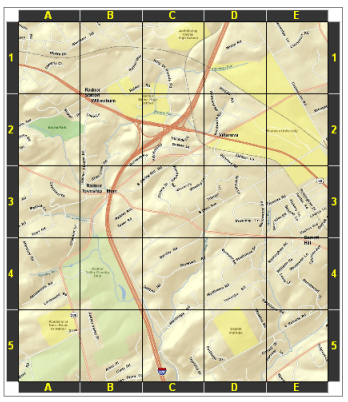
A grid is a network of evenly spaced horizontal and vertical lines used to identify locations on a map. For example, you can place a grid that divides a map into a specified number of rows and columns by choosing the reference grid type. Often, the row and column labels of a reference grid identify locations listed in a map index. Here is a map divided into five columns (A through E) and five rows (1 to 5):
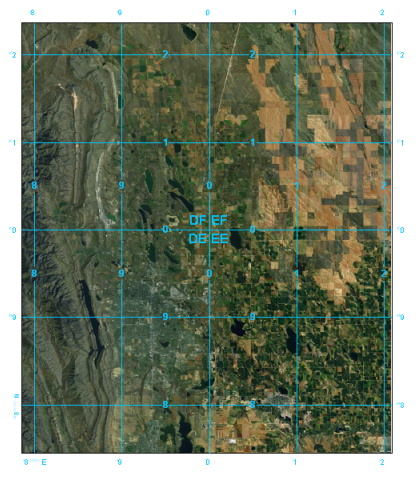
You can also use grids to display measured locations using projected coordinates on the map. There are numerous ways to display measured grids. For example, below is a map depicting a 10,000-meter grid using the Military Grid Reference System (MGRS):
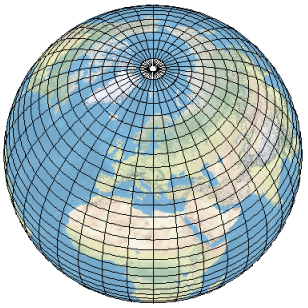
Graticules are lines showing parallels of latitude and meridians of longitude for the earth.
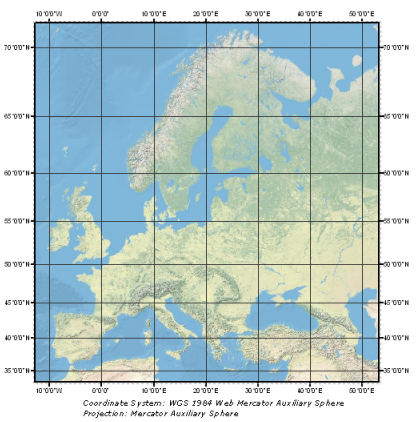
Graticules can be used to show location in geographic coordinates (degrees of latitude and longitude). Below is a map of Europe where graticules are visible for every 5 degrees latitude and 10 degrees longitude:
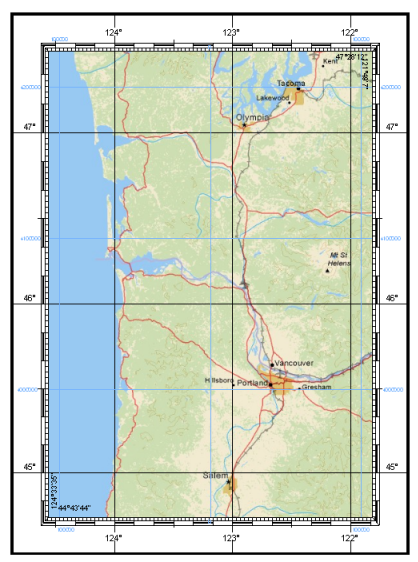
It is also possible to combine grids and graticules to display multiple coordinate systems on the same map. For example, you might want to use a measured grid to place Universal Transverse Mercator (UTM) grids and state plane grids. Or, as the example below illustrates, you might want to use a measured grid for a UTM projection (in blue) while also showing graticule lines (in black):
What are my options using ArcGIS?
ArcMap has three ways in which you can add grids and graticules to your map:
- Grids and Graticules Wizard
- Custom overlay reference grids
- Grid and Graticule layers
Deciding which option to use depends on the requirements of the grid or graticule you want in your map.
If you are interested in basic functionality, such as changing fonts and line symbols, don't have a need to edit the grid lines, and if you don't have to support complex grid scenarios such as crossing UTM zone boundaries, then the Grids and Graticules Wizard or creating a custom overlay reference grid should work for you.
If your map is dynamic, that is, your area of interest is constantly changing, you should use Grids and Graticules Wizard or create custom overlay grids.
However, if you want to make a grid for a map that you plan to edit or have a more complex scenario like crossing a UTM zone boundary or making a nonrectangular map, you will want to use Grid and Graticule layers.
Grids and Graticules Wizard
Grids and Graticules Wizard is available from the Grids tab on the Data Frame Properties dialog box. Using this wizard, you can add several types of grids and graticules to a map including graticules, measured grids, and reference grids. The grids and graticules created through this wizard are properties of the data frame. They cover the extent of the data frame or the clipped data frame shape and update dynamically as the map extent is panned and zoomed. They can only be viewed in layout view. You cannot view these in data view.
Learn more about using Grids and Graticules Wizard
When would you use Grids and Graticules Wizard?
- If you want the grid and coordinates to update as you pan and zoom the map
- If you need to be able to change the grid interval after the grid has been set up
- If you do not have an established map extent
Custom overlay reference grids
You can create custom overlay reference grids that use the geometry of a line or polygon data source to define the grid lines and an attribute column in this same feature class to specify the labels. A custom overlay grid allows you to superimpose an irregular or specialized reference system.
Learn more about creating custom overlay grids
You might use custom overlay grids if you want to create grids for the following:
- Boundaries of a U.S. state plane coordinate system (SPCS) zone
- Boundaries of a world geographic reference (GEOREF) system
- Boundaries of the extents of Operational Navigation Chart (ONC) or Joint Operations Graphic (JOG) maps
- Boundaries of the U.S. Geological Survey (USGS) quad sheets at the various scales at which they are produced (from 1:24,000 to 1:250,000 scale)
- Boundaries of the extents of International Map of the World map sheets
- Boundaries of world time zones and UTM zones
- When using the Military Grid Reference System, which includes the grid zones and 100,000-meter boundaries necessary to refer to a location using MGRS coordinates (ArcMap MGRS grids can also be used in map layouts requiring the U.S. National Grid reference system.)
Grid and Graticule layers
Grid and Graticule layers provide additional grid, border, and graticule capabilities in ArcGIS. They are not a replacement for the existing data frame grid properties but are used for the creation of grids intended for high-end cartographic and printed map products. Grid and Graticule layers are generated for specific map extents using the Make Grids and Graticules Layer geoprocessing tool and a grid definition file that provides the specifications. Grid definition files are delivered with ArcGIS for several generic grid formats, as well as for several standard grid formats including U.S. National Grid, defense map products, and national mapping organization-style maps.
Learn more about Grid and Graticule layers
When would you use Grid and Graticule layers?
- If you are producing a cartographic product that has a specification requiring advanced coordinate label formats, interior grid labels, interior grid tick patterns, complex border formats, or converging grid zones
- If you need the ability to edit the grid lines, ticks, and coordinate annotation, including splitting, deleting, or hiding portions of the grid lines
- If you want to mask portions of your grid using standard cartographic masking capabilities
- If you need to produce a grid with coordinate labels that follow a trapezoidal or nonrectangular shape, common with topographic maps
MGRS and U.S. National Grid
The Military Grid Reference System (MGRS) is a grid-based system used to represent locations on the universal transverse Mercator (UTM) and universal polar stereographic (UPS) coordinate systems, expressed as an alphanumeric string. An MGRS coordinate defines an area on the Earth's surface as opposed to a specific point. A fully qualified MGRS string is 15 characters long and consists of the following three components: grid zone designation, 100,000-meter square identifier, and easting/northing.
There are two methods for adding an MGRS or U.S. National Grid overlay to your map. If you need a dynamic grid that updates automatically as you pan and zoom, you can use the data frame grid properties with an MGRS or U.S. National Grid overlay grid. However, if you need to do one of the following, you will need to utilize a Grid and Graticule layer:
- Display the MGRS or U.S. National Grid in a coordinate system other than UTM
- Display UTM labels when your area of interest crosses UTM zones
- Display multiple MGRS or U.S. National Grid overlays within a single layout
- Display the MGRS or U.S. National Grid for rotated and nonrectangular areas of interest
- Change the MGRS or U.S. National Grid interval
- Place interior ladder labels for alternate intervals
Grid and Graticule layers support these complex grid and graticule scenarios. However, they are not dynamic and will not update as you pan and zoom.
Related topics
- A quick tour of data frame grids and the Grids and Graticules Wizard
- What are grid and graticule layers?
- Adding a graticule
- Adding a reference grid
- Adding a measured grid
- Creating custom overlay grids
- GUID-8C1B4908-C4F5-473E-983D-755AC2E4EF54
- GUID-92DA7D7E-EF35-4BCF-836F-2059BB700C8C
- Adding an MGRS or a U.S. National Grid