Available with Spatial Analyst license.
From the cell perspective, the objective of the cost tools is to determine the least costly path to reach a source for each cell location in the Analysis window. The least accumulative cost path to a source, the source that allows for the least-cost path, and the least-cost path itself must be determined for each cell.
The cost distance tools are similar to Euclidean tools, but instead of calculating the actual distance from one location to another, the cost distance tools determine the shortest weighted distance (or accumulated travel cost) from each cell to the nearest source location. These tools apply distance in cost units, not in geographic units.
All cost distance tools require both a source dataset and a cost raster as input.
Cost distance outputs
The different types of output from the cost distance tools are described in the following sections.
Distance output
The output from the Cost Distance tool records the accumulated cost of getting from each cell to the nearest source.
For example, consider the following source locations, identified as values 1 and 2 in the diagram:

The accumulated least costly way of getting from source cell 1 (dark orange) to the destination (the school icon) is 10.5.

Back link direction output
While the output cost distance raster identifies the accumulative cost for each cell to return to the closest source location, it does not show which source cell to return to or how to get there. The Cost Back Link tool returns a direction raster as output, providing what is essentially a road map that identifies the route to take from any cell, along the least-cost path, back to the nearest source.
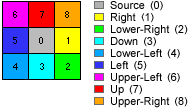
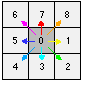
The algorithm for computing the back link raster assigns a code to each cell. The code is a sequence of integers from 0 to 8. The value 0 is used to represent the source locations, since they have essentially already reached the goal (the source). The values 1 through 8 encode the direction in a clockwise manner starting from the right. Following is the default symbology applied to the directional output, accompanied by an arrow diagram matching directional arrows to the color symbology:


For example, if an output cell is assigned the value 5 as part of the least-cost path to a source, the path should move to the neighboring cell on the left. If that cell has 7, the path should move due north, and so on.
From the example in the previous section, the cheapest way to get from the cell with a value of 10.5 to the source (the school site) is to go diagonally, through the cell with a value of 5.7. The back link raster shows the travel direction from each cell to the nearest source.


The direction algorithm assigns a value of 4 to the cell with a value of 10.5 and 4 to the cell with a value of 5.7, because (from the directional coding described above) this is the direction of the least-cost path back to the source from each of these cells.
This process is done for all cells in the output back link raster, producing an output that tells you the direction to travel from every cell in the cost distance raster back to the source.


Allocation output
The output from the Cost Allocation tool identifies the nearest source each cell is allocated to. It is conceptually similar to the output from the Euclidean Allocation tool, with the difference that nearness is expressed in terms of accumulated travel cost.

Optional outputs
In addition to the specific output raster from each tool, the cost tools can also optionally create other types of cost outputs. The Cost Distance tool can create a cost back link raster, and the Cost Back Link tool a cost distance raster. The Cost Allocation tool can create both the distance and back link rasters. This is useful if you want to create other outputs from the execution of a single tool.
Cost Path tool
Once the accumulative cost and back link rasters are created, least-cost path routes can be derived from any designated destination cell or zones. The Cost Path tool retraces the destination cells through the back link raster to a source.
Cost distance inputs
Source input
If the source dataset is a raster, it may contain single or multiple zones. These zones may or may not be connected. All cells that have a value (including 0) are processed as source cells. All non-source cells must be assigned NoData in the source raster. The original values assigned to the source locations (raster or feature) are retained.
If the source dataset is a feature dataset, it will be converted internally to a raster at the resolution determined by the environment; if the resolution is not explicitly set there, it will be the same as the input cost raster. If the source data is a raster, the cell size of that raster will be used. From this point forward, this documentation will assume that feature source data has been converted to raster.
There is no inherent limit to the number of sources in the input raster or feature source data.
Cost input
The cost raster can be a single raster and is generally the result of the composite of multiple rasters. The units assigned to the cost raster can be any type of cost desired: dollar cost, time, energy expended, or a unitless system that derives its meaning relative to the cost assigned to other cells. The values on the input cost raster can be integer or floating point, but they cannot be negative or 0 (you cannot have a negative or zero cost). The cost raster cannot contain values of 0 since the algorithm is a multiplicative process.
For more information on how cost distance is calculated, see the following section.