Available with 3D Analyst license.
You may want to visualize feature data, as well as surfaces, in a perspective view.
Feature data differs from surface data because it represents discrete objects rather than continuous phenomena. Features typically have a shape (geometry) and attributes.
Some typical feature geometries are point, line, and polygon. Point features might represent mountain peaks, telephone poles, or well locations. Lines might represent roads, streams, or ridgelines. Polygons might represent buildings, lakes, or administrative areas. The attributes of features can store values that refer to the elevation or height of the features. Some GIS features store elevation values with the feature geometry itself; for example, PointZ features are stored as a set of x,y,z coordinates. You can use z-values in the geometry or attributes of features to display the features in a 3D view.
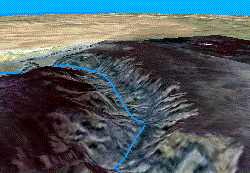
Sometimes features lack elevation or height values. You can still view these features in a 3D display by draping them (see below). If you have a surface model for the area, you can use the values in the surface as z-values for the features. This is called draping the features. You can also use this technique to visualize image data in 3D.

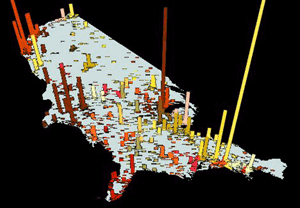
If you want to show building features in 3D, you can extrude them using an attribute, such as building height or number of stories. You can also extrude features based on an arbitrary value. Sometimes you'll want to view 2D features in a scene with z-values taken from some attribute other than a height value. For example, you might create a scene that shows city points extruded into columns based on their population (see below).

Learn more about displaying features in 3D in ArcGlobe