Available with 3D Analyst license.
Large volumes of lidar and surface data can be consumed in ArcGIS through a LAS dataset, which is a simple container definition of one or more lidar (LAS) files that represent a single, logical unit. For example, you could have several thousand LAS files that together cover an entire administrative area or perhaps just a few LAS files for a specific study area.
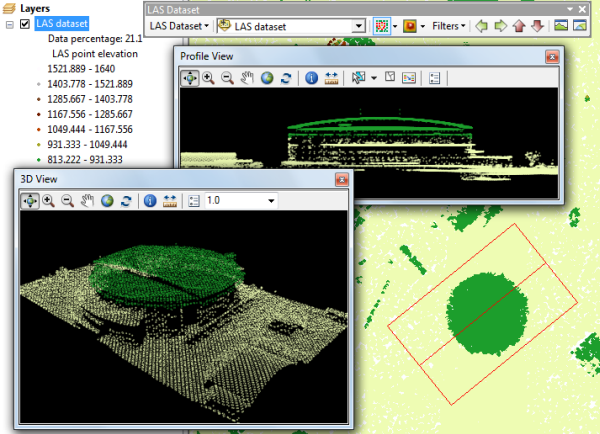
The LAS dataset has specific behavior allowing the storage and display of lidar and surface data measurements. A LAS dataset can be visualized in ArcGIS in both 2D and 3D using ArcMap and ArcScene. LAS datasets can be displayed as either points or a triangulated surface.
LAS datasets have point thinning capability that helps speed up the display, particularly at small scales, when a large volume of data is involved. To learn more about scalability with LAS datasets, see LAS dataset scalability.
You add LAS
datasets into ArcMap or ArcScene using standard techniques, such as the Add
Data  button or wizard or dragging from the Catalog window; simply
adjust the default renderer to meet your needs. When displaying LAS
datasets as points, you can use any of the LAS attributes, such as
classification, to define the point
symbology. When a LAS dataset is added to ArcMap or ArcScene, the default display is as points with the All Return filter set.
When you add a LAS dataset into ArcMap or ArcScene, a layer is added to the table of contents, thereby providing access to standard layer functionality through the Layer Properties dialog box. In most ways, a LAS dataset layer works the same whether inside ArcScene or ArcMap. You can define general layer properties, such as Layer Name and Description, as well as set LAS-specific properties, such as the filters and lidar attribute renderers.
The LAS dataset surface-based layer type is similar to TIN or terrain dataset layers in that it supports multiple display renderers. You can view the triangles colored by elevation range, slope, aspect, and contours. You can see the breaklines, triangle edges, and nodes of the triangulated surface. You can also use LAS dataset-specific point symbology renderers: LAS attribute grouped with unique symbol and LAS point elevation with graduated color ramp.

The initial display of a LAS dataset is different between ArcMap and ArcScene.
When a LAS dataset is added to ArcMap, the point count is often too high to display initially. Therefore, the minimum bounding boxes representing the extents of each LAS file in the LAS dataset are shown. When a LAS dataset is going to be drawn the total number of points within the current extent is estimated. The number of points directly corresponds to the amount of data on disk that needs to be scanned. The display will switch to the wireframe view if the estimated number of points is too large and would therefore take too long to read from disk.
When a LAS dataset is added to ArcScene, the minimum bounding boxes representing the extents of each LAS file in the LAS dataset are shown each time the LAS data is drawn in the scene. These boxes disappear once each LAS file is loaded or reloaded.
The Identify tool  allows you to display additional information
corresponding to a selected lidar point. Once a point has been selected, location and lidar attribute information about the point is displayed.
To learn more about displaying LAS datasets, see the following:
Displaying LAS datasets as a surface in ArcMap
Displaying LAS datasets as points in ArcMap
Displaying LAS datasets as a surface in ArcScene
Displaying LAS datasets as points in ArcScene
Displaying LAS datasets in ArcScene at full resolution
To learn more about display differences between ArcMap and ArcScene, see the following:
LAS dataset point display differences between ArcMap and ArcScene
LAS dataset surface display differences between ArcMap and ArcScene