Available with 3D Analyst license.
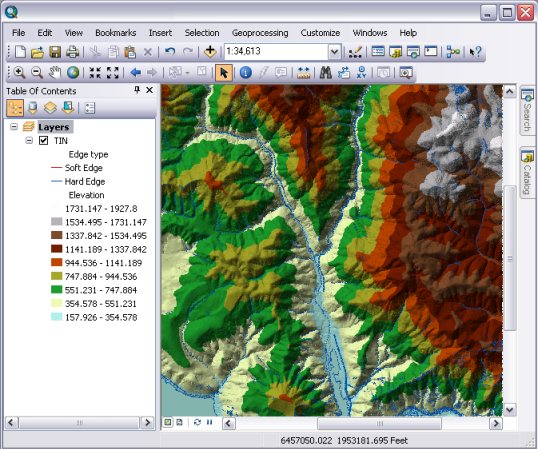
Triangulated irregular networks (TINs) represent continuous surfaces such as terrain elevation or temperature gradient. The surface is represented as a set of facets formed by connecting data points at nodes to create adjacent triangles. Typically, you display a TIN using color-shaded relief to depict elevation. Shaded relief simulates the sun's illumination of the earth's surface. Adding color to this lets you easily see the ridges, valleys, and hillsides and their respective heights. Seeing the data this way can help explain why other map features are where they are.
You can display any one of three surface characteristics—slope, aspect, and elevation—on your map and you can simulate shaded relief. You can also display contour lines representing lines of elevation change.
Geographic features that cross the surface—such as a river, road, or shoreline—can be explicitly represented in a TIN with a breakline. These features form the edges of triangles and, therefore, influence the surface at their location. Since the underlying triangulation defines the surface, you might want to take a closer look at it.
You can also display the internal structure of a TIN—for example, nodes and breaklines—independently or on top of the shaded relief display.
You can display just one type of TIN feature—for example, just the triangles—or all the TIN features. You can also symbolize each feature type using separate symbology. TIN nodes and triangles can be tagged with integer values to allow you to store additional information about them. These integer values can be used as lookup codes—for example, to indicate the accuracy of the input feature data source or the land-use type code for areas on the surface. The codes can be derived from fields in the input feature classes. You can symbolize tagged features with unique values. There are several different symbology display options for TIN surfaces available in ArcGIS.
