Available with Business Analyst license.
Overview
The Append Data tool allows you to extract data from one layer, such as block groups, and add it to an overlay layer, such as a trade area that you have created in Business Analyst.
Spatial overlay helps you answer the following questions:
- How many households are there in my overlay polygons?
- What are the demographic characteristics of each of my customers?
- What is the per capita income in this market area?
Input Prerequisites
Append data in Business Analyst works not only with polygons but also with point layers. The possible input layer and overlay layer combinations are as follows:
[Input layer]Overlay layer
- [Polygon]Polygon
- [Point]Polygon
- [Polygon]Point
Example output
If the overlay layer is a polygon and cuts across a polygon input layer, the data will be apportioned based on the apportionment method identified in the Custom Data Setup wizard. This is one of the four method choices: area, population (Block Point), households (Block Point), or total housing units (Block Point). Geography layers that come with Business Analyst are already set up with Block Point apportionment methods but can be changed using the Analysis Layer Setup wizard.
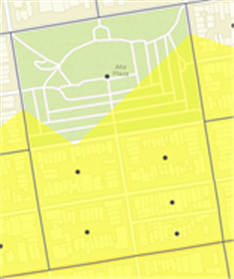
The image below illustrates the difference between the two methods. The yellow polygon is a drive time area and the overlay layer, which will be receiving the appended data. The gray lines are Block Group boundaries and the points are Block Points, which contain accurate population, household, and housing unit totals.
The yellow drive time polygon overlays about 70% of the Block Group below it. Using Area Apportionment, 70% of the population from the underlying Block Group would be assigned and appended.
We can see an immediate issue with this approach as roughly 50% of the Block Group is a park and the 70% overlay area appears to capture all of the residential area of the Block Group.
Processing this same example but with a Block Point apportionment method employed returns more accurate results. In this case, demographics for the 5 overlaid Block Points are summarized and the one point outside of the yellow area, which contains a population count of 0, is omitted.
This approach returns the correct results. The drive time overlays 70% of the Block Group area but covers 100% of the Population, Households, and Housing Units.

Learn more about Append Data (Spatial Overlay).