Available with Business Analyst license.
Edit mode allows you to modify sections and individual cells. To access these features, right-click in the report in Edit mode.

Below are some functionality descriptions and use examples:
- Conditional Replacement - Allows you to use replacement values less than or equal to zero.
- Hyperlink - Enables URL hyperlinks within a cell via a static web address from a selected variable or another variable field.
- Cell Style - Provides formatting options to simulate standard Esri report templates.
- Conditional Formatting - Allows you to change the style of a cell based on the cell value such as positive values in black and negative values in red.
- Table Properties - Adjusts the column and row count for the entire table. For example, you can choose General Data for one trade area per page or Multi-ring Table for two or more trade areas per page. You can also set offsets in the report. The Position (in) section allows you to shift tables inside a section. This is used to insert custom logos or graphics as floating pictures. You can also set the fields drop orientation to vertical or horizontal cells.
- Section Properties - Manages sections with page breaks to indicate the page where the data table resides. You can add pre-formatted lines to sections for clean formatting by clicking the horizontal line on top of the section or bottom of the section check boxes. You can hide sections, rather than deleting them, by clicking the Suppress section check box. You can also alter the section style, such as default or locator (point) based and set "group by" types. Inside a single section you can only use fields from one data query. That is, you cannot use "locator" fields like DISTANCE or DIRECTION in the same section as demographic variables and vice versa.
Example
We are going to highlight household incomes below $50,000 in red for areas in the report.
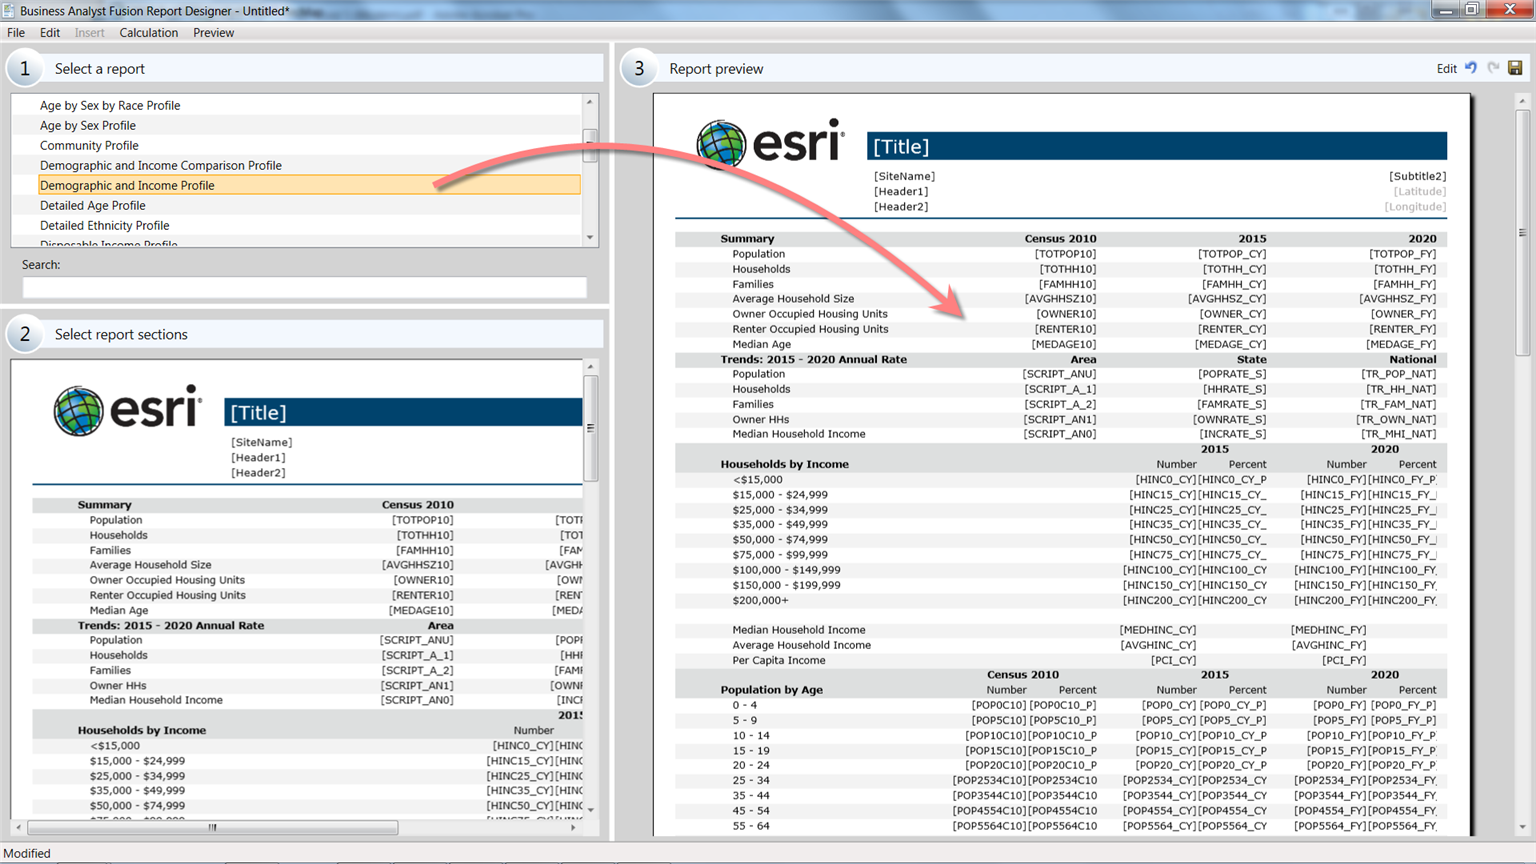
Open the Fusion Report Designer. Once inside you will open or create a new report template. Drag and drop the entire Demographic and Income Profile report into the Report preview pane.

Click Edit to get into the Edit report pane.
Right-click on a variable you wish to highlight in your report, in this case Median Household Income [MEDHINC_CY], and choose Conditional Formatting....
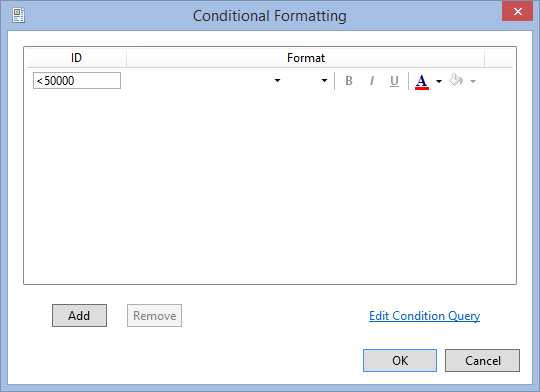
The following window is launched.

- Click Add to bring up a condition.
- Choose Less Than from the Cell Value: drop-down menu and enter 50000 as the value. There is an option to add intervals.
- Enter font values to highlight the condition. In this case we are making the font red when the condition is met.
- Click OK to exit and save the conditional statement or click Advanced... for higher-level queries.

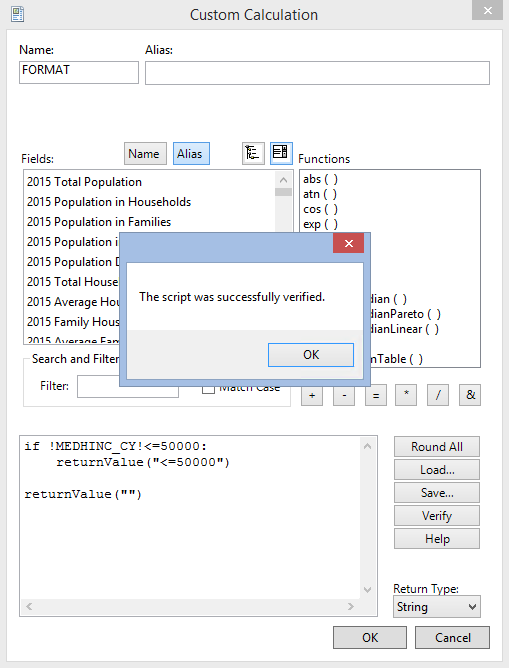
Click Edit Condition Query to launch the Custom Calculation window.
You can edit the script in the window below with the following If statement:
Custom Calculation - Python Script
if !MEDHINC_CY!<50000:
    returnValue("<50000")

returnValue("")
Click Verify to ensure the statement is correct.

Click OK to close the Custom Calculation window. Click OK to close the Conditional Formatting window.
The resultant report will highlight areas (Zip Codes) in red that have household incomes below $50,000.
