ArcGIS Desktop

  • ArcGIS Pro
  • ArcMap

  • My Profile
  • Help
  • Sign Out
ArcGIS Desktop

ArcGIS Online

The mapping platform for your organization

ArcGIS Desktop

A complete professional GIS

ArcGIS Enterprise

GIS in your enterprise

ArcGIS Developers

Tools to build location-aware apps

ArcGIS Solutions

Free template maps and apps for your industry

ArcGIS Marketplace

Get apps and data for your organization

  • Documentation
  • Support
Esri
  • Sign In
user
  • My Profile
  • Sign Out

ArcMap

  • Home
  • Get Started
  • Map
  • Analyze
  • Manage Data
  • Tools
  • Extensions

Customer Demographic Comparison

Available with Business Analyst license.

  • Example of a Customer Demographic Comparison report

The Customer Demographic Comparison report allows you to contrast the demographic attributes of one set of customers against another. You can compare a selected subset of customers to the entire layer or compare two separate customer layers.

Think of the report as using a combination of Customer Profiling and the Benchmark report. It takes a profile of the underlying geographies that intersect your customer points and compares it to another customer profile you select. The differences are shown by total number and percentage.

Note:

The Customer Demographic Comparison report can be run in the background or foreground in the 64-bit environment. Business Analyst 64-bit background geoprocessing is installed during the product setup and is the default processing option. You can switch between background or foreground options from Geoprocessing menu > Geoprocessing Options > Background Geoprocessing section. Running tasks in the background allows you to continue your work in ArcMap as the task executes.

To enable, or disable, background processing navigate to the General tab of the tool properties and check, or uncheck, the Always run in foreground check box.

Read more about 64-bit Background Geoprocessing.

Example of a Customer Demographic Comparison report

The Customer Demographic Comparison report lists each variable that makes up your customer demographic profile along with the percentage and numerical differences between two customer layers or a selected set of customers versus the whole layer.

In the image below the report shows the difference between the San Francisco customers layer, from the tutorial, and a small selection of those customers.
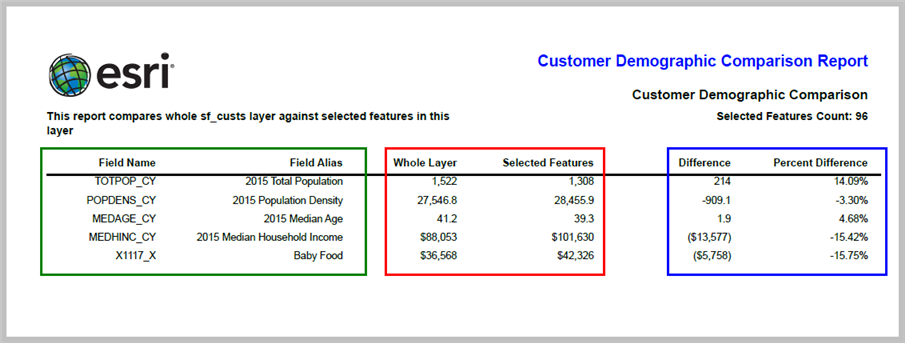
Customer Demographic Profile Report

The above comparison report shows the following.

  • The columns within the green box shows the demographic Field Name and Field Alias.
  • The columns within the red box shows total figures of the Whole Layer vs the Selected Features.
  • The columns within the blue box shows the Difference and Percent Difference between the customer layer and the customer selection.

Learn more about customer demographic comparison.

ArcGIS Desktop

  • Home
  • Documentation
  • Support

ArcGIS

  • ArcGIS Online
  • ArcGIS Desktop
  • ArcGIS Enterprise
  • ArcGIS
  • ArcGIS Developer
  • ArcGIS Solutions
  • ArcGIS Marketplace

About Esri

  • About Us
  • Careers
  • Esri Blog
  • User Conference
  • Developer Summit
Esri
Tell us what you think.
Copyright © 2022 Esri. | Privacy | Legal