Available with 3D Analyst license.
3D Analyst Options menu
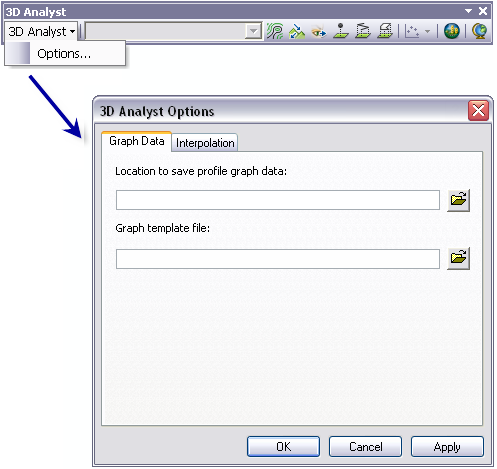
3D Analyst Options is a drop-down menu where certain settings can be found for the 3D Analyst toolbar tools. These commands allow you to control interpolation techniques and save your graphic data.
The Graph Data tab on the 3D Analyst Options dialog box is where you can define the location used for saving profile graphs to disk. If a folder location is specified, then a shapefile will be created each time a profile is created.
Additionally, on the Graph Data tab, you can specify a graph template to apply design elements to new graphs using an existing graph file. Several graph templates are provided with ArcGIS and can be accessed from the installation folder typically found under the \ArcGIS\Desktop10.x\GraphTemplates directory. You can also create your own personal graph templates.

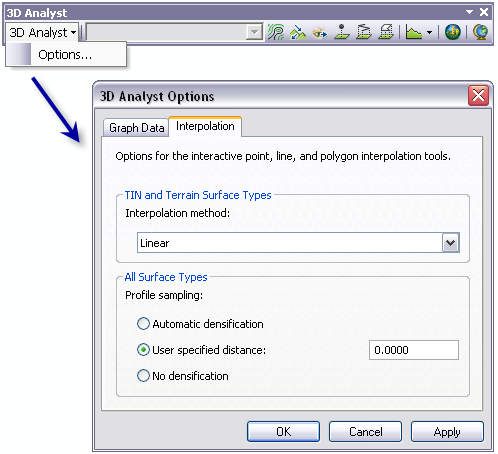
The Interpolation tab on the 3D Analyst Options dialog box provides interpolation methods and profile sampling techniques.

The interpolation methods are used to define the z-values when using either the point, line, or polygon interpolation tool. These interpolation methods apply only when 3D analysis is being conducted on a TIN or terrain dataset surface. The table below provides a description of each interpolation method available when working with TINs and terrain datasets.
Interpolation methods available for TINs and terrain surfaces
| Interpolation method | Description |
|---|---|
Linear | Default interpolation method. Estimates z from the plane defined by the TIN or terrain triangle that contains the x,y location of a query point. |
Natural neighbors | Estimates z by applying area-based weights to the TIN or terrain's natural neighbors of a query point. |
Conflate z min | Obtains z from one of the TIN or terrain's natural neighbors of a query point. The z of the neighbor with the minimum height is used. |
Conflate z max | Obtains z from one of the TIN or terrain's natural neighbors of a query point. The z of the neighbor with the maximum height is used. |
Conflate closest to mean | Obtains z from one of the TIN or terrain's natural neighbors of a query point. The z of the neighbor that is closest to the average height of all the neighbors is used. |
Conflate z of nearest | Obtains z from one of the TIN or terrain's natural neighbors of a query point. The z of the neighbor closest in x,y to the query point is used. |
The Profile sampling options are used to define sampling techniques along a profile line. These methods apply when 3D analysis is being conducted on either a raster, TIN, or terrain dataset surface. The table below provides a description of the three profile sampling methods available.
Profile sampling methods
| Profile sampling method | Description |
|---|---|
| Automatic densification | The profile graph is generated from the original input vertices plus additional samples where the profile intersects triangle edges for TIN and terrain surfaces. With raster surfaces, the original vertices plus densification points added using the cell size are used to generate the profile graph. |
User specified distance | The profile graph is generated from the original input vertices plus additional samples along the profile at the user-specified distance. |
No densification | Only the original input vertices are used to generate the profile graph. |