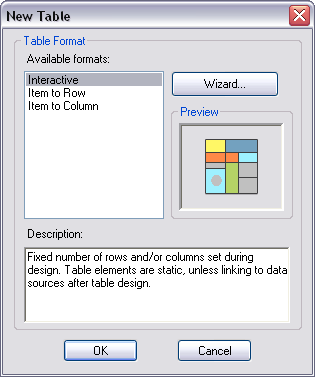
After you create symbols with the Representation Rule Dump tool, you can display the symbols in a graphic table element (GTE). Follow these steps to display representation rule symbols in a graphic table element.
- Start ArcMap.
- On the main menu, click View > Layout View.
- Create symbols with the Representation Rule Dump tool. tool if you haven't already and make sure that the data is loaded in ArcMap.
- In the main menu, click File > Page and Print Setup.
- If necessary, change the page size to 34 by 44 inches by doing the following:
- Uncheck the Use Printer Paper Settings check box.
- Type the width and the height.
- Click OK.
- On the main menu, click Insert > Graphic Table Element.
The New Table dialog box appears.

- Choose Item to Row in the Available formats list.
- Click Wizard.
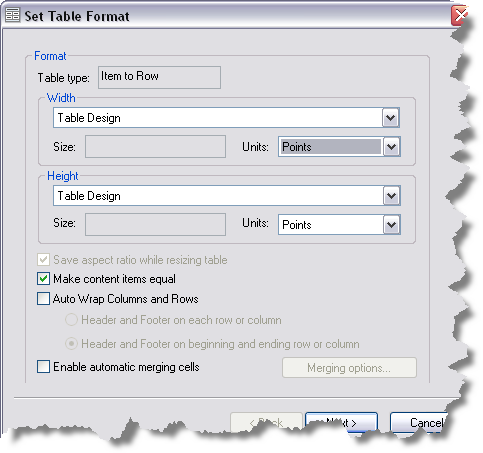
The Set Table Format dialog box appears.

- Click the Width drop-down arrow and choose Auto Fit cells.
- Click the Units drop-down arrow for the width and choose Inches.
- Click the Height drop-down arrow and choose Auto Fit cells.
- Click the Units drop-down arrow for the height and choose Inches.
- Type 10 in the Size text box.
- Check the Auto Wrap Columns and Rows check box.
- Click Header and Footer on each row or column to specify how you want the header and footer displayed.
Use a maximum of 999 to see the total number of items.
- Click OK.
- Click Finish.
- To modify a GTE, select the newly created element and adjust its placement by following these steps:
- Right-click Properties > Table Format.
- Modify the height size to control the number of columns (decrease to have fewer columns; increase to create more columns).
- Click OK.
- To convert the GTE to graphics, do the following:
- Right-click the GTE and click Convert to Graphics.
- Right-click the graphic and select Ungroup.