Available with Network Analyst license.
- Preparing your display
- Creating the location-allocation analysis layer
- Adding candidate facilities
- Adding Demand Points
- Setting up the properties of the location-allocation analysis
- Run the process to determine the best store locations
- Adding a required facility
- Setting up the properties of the analysis (maximize attendance with required facility)
- Run the process to determine the best store locations (maximize attendance with required facility)
- Adding competing facilities
- Setting up the properties of the analysis (maximize market share)
- Run the process to determine the best store locations (maximize market share)
- Achieving a target market share
- Run the process to determine the best store locations (target market share)
In this exercise, you will choose the store locations that would generate the most business for a retail chain. The main objective is to locate stores close to population centers, which provide demand for the stores. This objective is based on the premise that people tend to shop more at nearby stores than at those that are farther away. You will perform the location-allocation analysis using three different problem types: maximize attendance, maximize market share, and target market share. The differences among these problem types will become apparent as you work through the exercise.
Preparing your display
- If you have Exercise09.mxd open in ArcMap, skip to step 6.
- Start ArcMap.
- On the ArcMap - Getting Started dialog box, click Existing Maps > Browse for more.
- Browse to C:\ArcGIS\ArcTutor\Network Analyst\Tutorial.
This is the default installation location for the tutorial data.
- Double-click Exercise09.mxd.
The map document opens in ArcMap.
- Enable the ArcGIS Network Analyst extension.
- Click Customize > Extensions.
The Extensions dialog box opens.
- Check Network Analyst.
- Click Close.
- Click Customize > Extensions.
- Click Customize > Toolbars > Network Analyst.
The Network Analyst toolbar is added to ArcMap.

- On the Network Analyst toolbar, click the Network Analyst window button
 .
.
The dockable Network Analyst window opens.
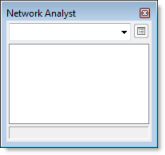
If the Network Analyst toolbar is not displayed, you need to add it.
If the Network Analyst window is not displayed, you need to add it.
You can dock or undock the Network Analyst window.
Creating the location-allocation analysis layer
- Click Network Analyst on the Network Analyst toolbar and click New Location-Allocation.
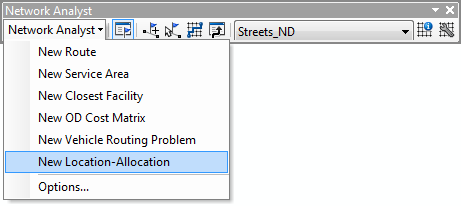
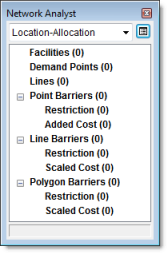
The location-allocation analysis layer is added to the Network Analyst window. The network analysis classes (Facilities, Demand Points, Lines, Point Barriers, Line Barriers, and Polygon Barriers) are empty.
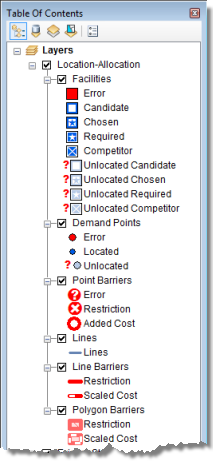
The analysis layer is also added to the Table Of Contents window.
Adding candidate facilities
You will add the candidate store locations to the network analysis class Facilities. These are the potential places where you can open a store. The solution from the location-allocation process will include a subset of these stores.
The candidate store locations are already added as a layer (CandidateStores) in the map document. The names of the stores are contained in the layer's attribute table. You will load the point features from CandidateStores into the Facilities class of the location-allocation layer.
- In the Network Analyst window, right-click Facilities (0) and choose Load Locations.
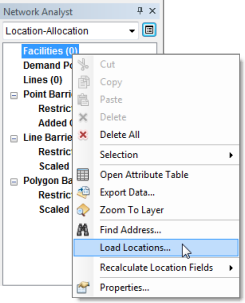
The Load Locations dialog box opens.
- Select CandidateStores from the Load From drop-down list.
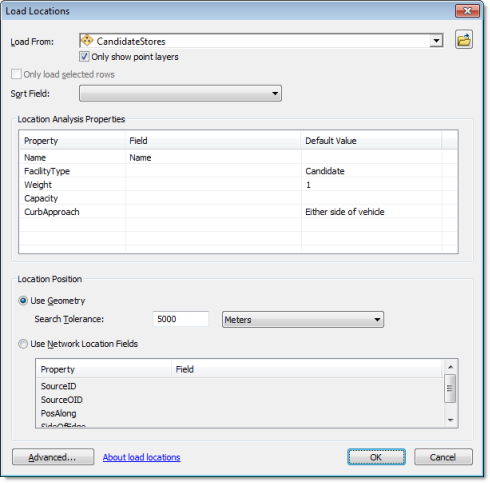
- In the Location Analysis Properties section, make sure the Name property is automatically mapped to the NAME field.
- Click OK.
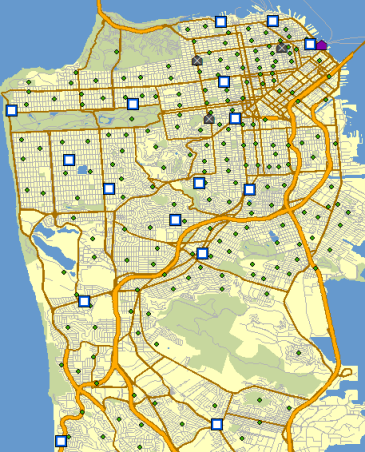
Sixteen candidate stores are loaded into the Facilities network analysis class. The new facilities are listed in the Network Analyst window and displayed on the map.
Adding Demand Points
The stores need to be located to best service the existing populations. A point layer of census tract centroids is already added to ArcMap. Now you will load these centroids into the demand points network analysis class.
- In the Network Analyst window, right-click Demand Points (0) and choose Load Locations.
- Select TractCentroids from the Load From drop-down list.
- In the Location Analysis Properties section, make sure the Name property is automatically mapped to the NAME field.
- Click the Field column for the Weight property and choose POP2000.
Each demand point will be weighted by the population from the 2000 census.
- Click OK.
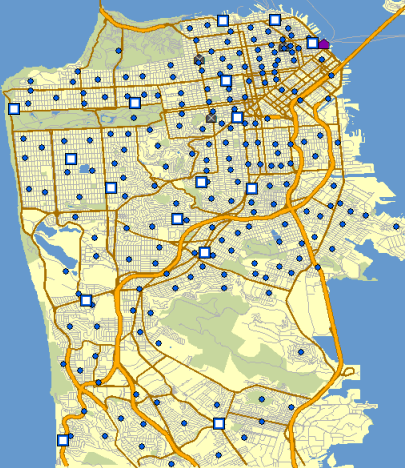
The 208 census tract centroids are loaded into the Demand Points class. The new demand points are listed in the Network Analyst window and displayed on the map.
Setting up the properties of the location-allocation analysis
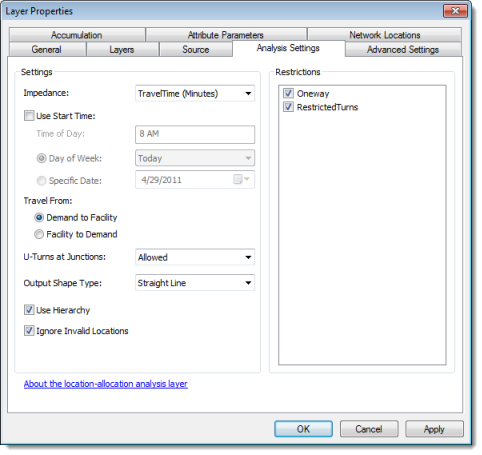
- Click the Analysis Layer Properties button on the Network Analyst window.

The Layer Properties dialog box opens.
- Click the Analysis Settings tab.
- Make sure that Impedance is set to TravelTime (Minutes).
- Leave Use Start Time unchecked.
If you need to solve a location-allocation analysis given the traffic for a specific time and day, you can enter a start time here.
- Set Travel From to Demand to Facility.
The default option, Facility to Demand, is a good choice for the classic minimize impedance and maximize coverage problem types. However, for maximize attendance, maximize market share, and target market share, the demand tends to travel to the facilities, thus Demand to Facility is often a good choice for them.
- Click the U-Turns at Junctions drop-down arrow and choose Allowed.
- Set Output Shape Type to Straight Line.
Although the output will be displayed with straight lines, the travel costs are still measured along the network.
- Make sure that the Use Hierarchy and Ignore Invalid Locations boxes are checked.
- In the Restrictions frame, make sure that RestrictedTurns and Oneway are checked.
- Click the Advanced Settings tab.
- Click the Problem Type drop-down list and choose Maximize Attendance.
These problem types are often referred to as models. Maximize attendance is a good problem type for choosing retail store locations, since it assumes that all stores are equally attractive and people are more likely to shop at nearby stores.
- Increase Facilities To Choose to 3.
ArcGIS will try to choose 3 facilities out of the 16 to optimally serve the 208 demand points.
- Increase Impedance Cutoff to 5.
This setting implies that people are not willing to travel more than five minutes to shop at these stores. The units for this value are determined by the units of the impedance attribute. Therefore, since TravelTime uses minutes, this value is also in minutes.
- Make sure that Impedance Transformation is set to Linear. ArcGIS will use a linear decay in calculating people's propensity to visit a store. That is, with a five-minute impedance cutoff and a linear impedance transformation, the probability of visiting a store decays at 1/5, or 20 percent; therefore, a store one minute away from a demand point has an 80 percent probability of a visit compared to a store four minutes away, which only has a 20 percent probability.
- Click OK.
Run the process to determine the best store locations
- Click the Solve button
 on the Network Analyst toolbar.
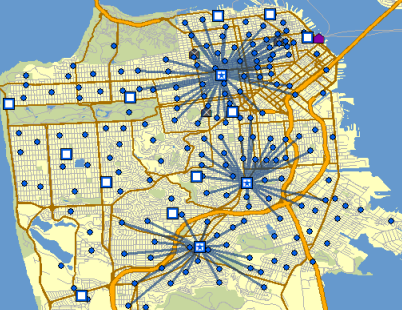
Once the solve process is completed, lines in the map display connect chosen stores to their associated demand points. The lines also appear in the Lines class in the Network Analyst window.
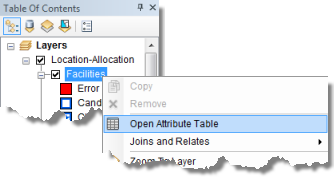
- In the Table Of Contents, right-click the Facilities sublayer and choose Open Attribute Table.
- Close the Facilities table.
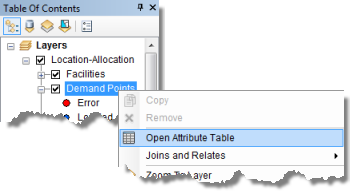
- In the Table Of Contents, right-click the Demand Points sublayer and choose Open Attribute Table.
- In the Table Of Contents, right-click the Lines sublayer and choose Open Attribute Table.
- Close the attribute tables.
Examine the attributes of the Facilities table. Three of the features have their FacilityType field values set to Chosen instead of the default status, Candidate.
The DemandCount column lists the number of demand points assigned to each of the chosen facilities. Note that out of the 208 demand points, only 113 were allocated to the chosen facilities because some of the points were farther than the five-minute cutoff.
The DemandWeight column lists the demand that is allocated to each facility. In this case, the value represents the number of people that are likely to shop at the store.
Examine the attributes of the Demand Points table. The Facility ID column has a value of <Null> if the demand point was outside the five-minute cutoff, but if a numeric value is present, it represents the ID of the chosen facility the demand point was allocated to.
The Weight column contains the population count that was loaded from the census tract feature class. The AllocatedWeight column contains the amount of demand that was apportioned to the associated facility. The amount of weight allocated is based on the linear distance decay and the five-minute cutoff parameters you set in the Layer Properties dialog box.
Adding a required facility
In the previous section, you generated results for where to locate three new stores. In this section, you will use location-allocation to solve a store-expansion scenario, in which you will start with an existing store and optimally locate two additional stores.
- In the Network Analyst window, right-click Facilities (16) and choose Load Locations.
The Load Locations dialog box opens.
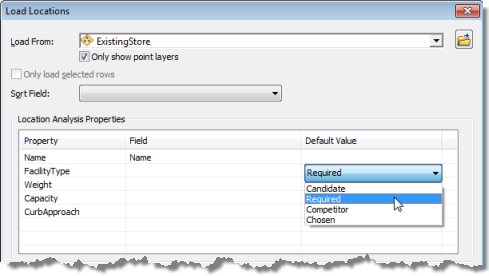
- Select ExistingStore from the Load From drop-down list.
- In the Location Analysis Properties section, make sure that the Name property is automatically matched to the NAME field.
- In the Default Value column for Facility Type, change Candidate to Required.
This ensures that when the store is loaded as a facility, it will have a status of Required. Required facilities must always be part of the solution.
- Click OK.
Setting up the properties of the analysis (maximize attendance with required facility)
You will use the same properties from the previous solution to solve this problem.
- Click the Analysis Layer Properties button on the Network Analyst window.

The Layer Properties dialog box opens.
- Make sure that the problem type is set to Maximize Attendance, the facilities to find is 3, the impedance cutoff is 5, and the impedance transformation is Linear.
- Click OK.
Run the process to determine the best store locations (maximize attendance with required facility)
- Click the Solve button
 on the Network Analyst toolbar.
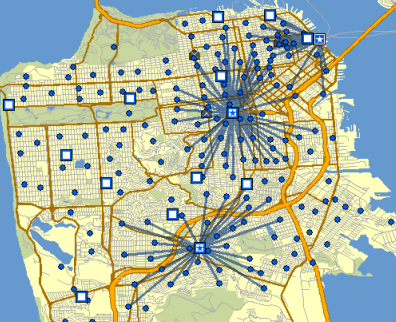
When the solve process is complete, lines connect chosen stores to demand points. Note that the original solution changed, and the ExistingStore location is now part of the solution. The other two chosen facility locations are now at different places.
Adding competing facilities
Location-allocation can locate new stores to maximize market share in light of competing stores. The market share is computed using a Huff, or gravity, model. A Huff model assumes that demand points have a probability of visiting stores based on some properties of the store as well as the distance away from that store.
- In the Network Analyst window, right-click Facilities (17) and choose Load Locations.
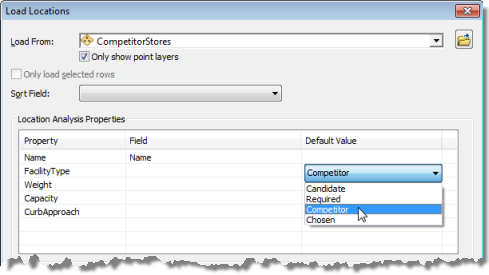
- Choose CompetitorStores in the Load From drop-down list.
- In the Location Analysis Properties section, make sure that the Name property is automatically matched to the NAME field.
- In the Default Value column for Facility Type, change Candidate to Competitor.
- Click OK.
Setting up the properties of the analysis (maximize market share)
You will change the properties of the location-allocation analysis layer so that it solves using the maximize market share problem type.
- Click the Analysis Layer Properties button on the Network Analyst window.

The Layer Properties dialog box opens.
- Click the Advanced Settings tab.
- Click the Problem Type drop-down list and choose Maximize Market Share.
- Click the Impedance Transformation drop-down list and choose Power.
ArcGIS will use a power distance decay in determining people's propensity to visit a store. Notice that Impedance Parameter becomes available for you to edit.
- Change the Impedance Parameter value to 2.
An impedance parameter of 2 on a power impedance transformation means the probability of visiting a store decays with the square of the distance between a demand point and a facility location. Usually, an accurate value of the impedance parameter is computed from other analyses, such as those provided by using ArcGIS Business Analyst.
- Click OK.
Run the process to determine the best store locations (maximize market share)
- Click Network Analyst on the Network Analyst toolbar and click Options.
The Network Analyst Options dialog box opens.
- Click the General tab.
- Click All Messages.
By choosing All Messages with a market share problem, the market share you capture will be reported in a dialog box once the solve process is completed.
- Click OK.
- Click the Solve button
 on the Network Analyst toolbar.
When the solve process is completed, a message indicates how much of the market share you captured.
- Close the message box.
- In the Table Of Contents, right click the Facilities sublayer and choose Open Attribute Table.
- Close the attribute table.
Lines in the map connect demand points to chosen and competitor stores. Notice the chosen stores have changed to maximize the amount of demand given the presence of the three competitors.
The lines overlap more than in the previous solutions, since each demand point in the maximize market share problem can interact with all the facilities that are within the impedance cutoff.
Three facilities have a FacilityType value of Competitor, one has a value of Required, and two have a value of Chosen, which indicates the solver chose them as the best facilities to open.
The DemandCount column lists the number of demand points assigned to each of the facilities. Note that some demand points were not assigned, since they were outside the five-minute cutoff.
The DemandWeight column lists the sum of the demand weight assigned to each of the chosen facilities. The weight assigned to your stores versus that assigned to the competitor stores can be used to figure out the market share that was reported after the solve process finished.
Achieving a target market share
In the last section, the three stores chosen accounted for 33.79 percent of the market share. Say, however, you want to capture 70 percent of the market share. You need to know the minimum number of stores that would be needed, and where they should be located, to accomplish that goal. The target market share problem type can help you find the answer.
- Click the Analysis Layer Properties button on the Network Analyst window.

The Layer Properties dialog box opens.
- Click the Advanced Settings tab.
- Click the Problem Type drop-down list and choose Target Market Share.
Notice that when you change the problem type to Target Market Share, the Target Market Share (%) property becomes available for you to edit.
- Change Target Market Share (%) to 70.
- Click OK.
Run the process to determine the best store locations (target market share)
- Click the Solve button
 on the Network Analyst toolbar.
When the solve process is complete, a message indicates how much of the market share you captured and the total number of facilities required to capture that share. The percentage is more than the 70 percent you had indicated, because opening any fewer facilities would result in a market share below your target of 70 percent.
- Close the message box.
- In the Table Of Contents, right-click the Facilities sublayer and choose Open Attribute Table.
- Exit ArcMap. Click No to discard changes.
Once again, lines connect the solution facilities to demand points in the map display.