- Engine
- ArcGIS for Desktop Basic
- ArcGIS for Desktop Standard
- ArcGIS for Desktop Advanced
- Server
Additional library information: Contents, Object Model Diagram
The System library is the lowest-level library in the ArcGIS architecture. This library contains components that expose services used by the other libraries in ArcGIS. There are a number of interfaces defined within the System library that can be implemented by developers.
The System library contains the important AoInitialize object; developers must use this object to initialize and uninitialize ArcGIS Engine in applications that use ArcGIS Engine functionality.
Developers do not extend the System library but can extend the ArcGIS system by implementing interfaces contained within this library.
The System library contains many diverse objects with unrelated functionality.
See the following sections for more information about this namespace:
Arrays and sets
The array and set objects act as containers for collections of other objects and values. They are used throughout ArcObjects. The array and set objects are shown in the following illustration:
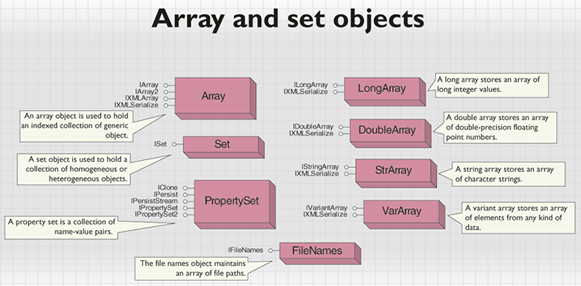
The LongArray, DoubleArray, StrArray, and FileNames objects store collections of particular kinds of data; that is, they are homogenous collections.
The Array, Set, PropertySet, and VarArray objects store heterogeneous data. Array and Set hold collections of objects, although in Set, an object can only be a member once. PropertySet is a keyed collection of objects or values. VarArray is a collection of variants and can hold a variety of data.
Extensions
Extensions provide a powerful mechanism for extending the core functionality of the ArcGIS applications. An extension can provide a toolbar with new tools, listen for and respond to events, perform feature validation, and so on. Extensions act as a central point of reference for developers when they are creating commands and tools for use within the applications. Often these commands and tools must share data or access common user interface (UI) components. An extension is the logical place to store this data and develop the UI components. The main reason for this is that there is always only one instance of an extension per running application and, given an IApplication interface or with the ExtensionManager object, it is always possible to locate the extension and work with it. The application and extension interfaces are shown in the following illustration:
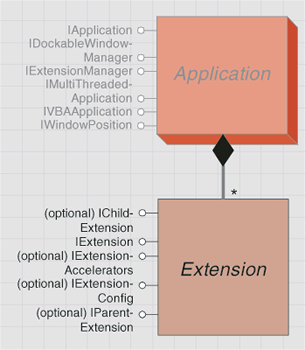
The ExtensionManager object allows you to enable licensed extensions, such as ArcGIS 3D Analyst, within your stand-alone application. Being a singleton object, ExtensionManager is the one and only instance of its class. An application can have only one ExtensionManager object. You can cocreate and use ExtensionManager from within ArcMap, but there is no real need since the IExtensionManager interface is also available on the Application object.
Streams
When implementing your own objects, you sometimes need to provide support for persistence. For example, with a custom feature renderer, persistence enables its settings to be written to a .mxd file so that when ArcMap is restarted, the layer with custom rendering is drawn in the same way as previously drawn. The Component Object Model (COM) concept of streams provides a way of reading and writing data to the persisted storage. The stream objects are shown in the following illustration:
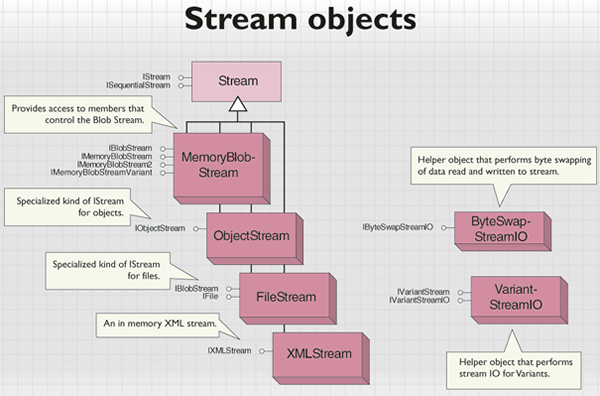
To provide persistence support for your custom object, implement one or both of IPersistStream and IPersistVariant. You can consume these interfaces on existing objects, particularly in your persistence implementation of your custom object. However, also consider the use of an ObjectStream class in this situation.
ArcObjects defines some specific stream objects that are useful in persisting data. Each one implements the standard COM interfaces ISequentialStream and IStream. MemoryBlobStream provides storage for binary data in memory. It is particularly useful for writing arbitrary data to databases. ObjectStream is used in conjunction with another stream to persist ESRI objects. FileStream is a specialized kind of stream for reading and writing files. XMLStream supports reading and writing Extensible Markup Language (XML) from files, strings, and binary buffers.
There are two stream helper objects. One, ByteSwapStreamIO, helps convert the byte order of data; for example from big endian to little endian. This can be important for programs that need to work on both Windows and UNIX systems. The other, VariantStreamIO, provides help for reading and writing variants to and from streams.
Component categories
Component categories are used by client applications to efficiently find all components of a particular type that are installed on the system. For example, ArcMap only supports commands that implement the ICommand interface. A component category, ESRI Mx Commands, is used to find all the command components that can be used in ArcMap. If component categories were not used, the application would have to instantiate each COM component and interrogate it to see if it supported the required functionality, which is not a practical approach. Component categories support the extensibility of COM by allowing the developer of the client application to create and work with classes that belong to a particular category. If, at a later date, a new class is added to the category, the client application need not be changed to take advantage of the new class; it automatically picks up the new class the next time the category is read.
The ComponentCategoryManager object lets you add or remove components from categories and create new categories.
The CategoryFactory object is used to read the information in the registry to determine what classes are in a particular category. It can be used to instantiate an object from each class registered to a component category.
XML
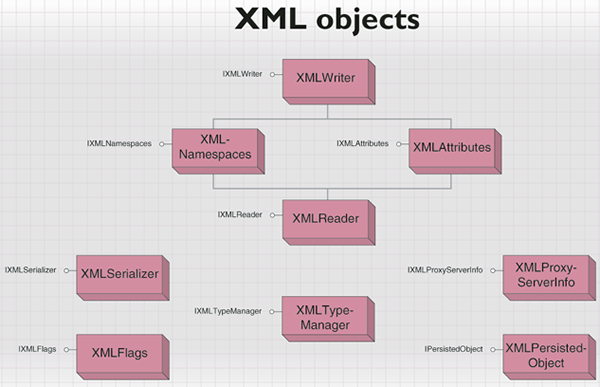
The XML objects are used for reading and writing XML documents in a forward-only manner. The XML objects are shown in the following illustration:
Basic XML
The XMLStream object is an in-memory buffer that supports reading and writing XML from files, strings, and binary buffers. The stream is written to, or read from, the XMLWriter and XMLReader objects. When reading or writing XML elements, you can represent the attributes and namespace declarations of an XML element with the XMLAttributes and XMLNamespaces classes.
The XMLTypeMapper class converts native types to XML Schema simple types.
XML serialization
The XMLSerializer class serializes and deserializes ArcObjects components that support IXMLSerialize. When using XMLSerializer, you can specify serialization flags with the XMLFlags class. The wrapper object XMLPersistedObject is used with XMLSerializer to serialize and deserialize ArcObjects components that support IPersistStream.
Classify
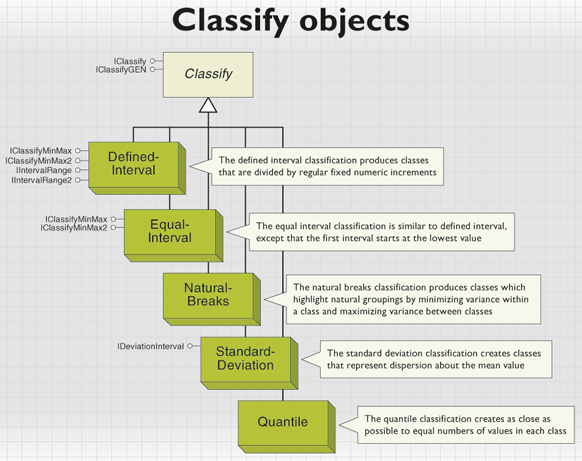
This group of closely related objects can be used to group numeric values into classes. There are five types of classification objects: DefinedInterval, EqualInterval, NaturalBreaks, StandardDeviation, and Quantile coclasses. The job of all classification objects is to take histogram data (values and frequencies) and, given a desired number of classes, compute appropriate break values between the classes. The breaks are in increasing value and, except for the first break, represent the highest value in the class. The range of values that a class covers can vary; this range is the class's interval. If the values are from the attribute values of a feature layer, then after determining the class breaks, you typically set up ClassBreaksRenderer.
The task of gathering the values and frequency counts from an attribute field is easier if you use the TableHistogram object to retrieve the histogram data. TableHistogram is defined in the CartoUI library. The histogram data is in the form of two arrays. The first of these is a sorted array of numeric values, and the second is a corresponding array of frequency counts of the values. The Classify objects are shown in the following illustration:
The following map examples illustrate usage of the different classify objects:
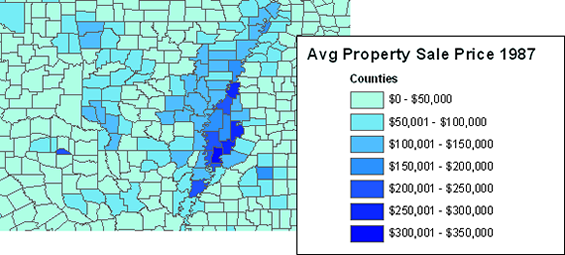
- DefinedInterval—The following map uses a defined interval classification to illustrate average house prices in different counties. The interval is $50,000, so the class breaks are multiples of this amount.
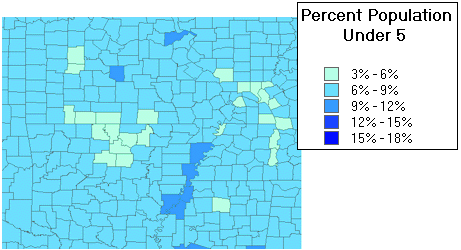
- EqualInterval—The following map illustrates areas where there are differing populations of infants relative to the population of the area. It is produced using an equal interval classification where the minimum is 3 percent of the population being under age five, then in bands of 3 percent, shows increasing numbers of people under age five (up to 18 percent of the population).
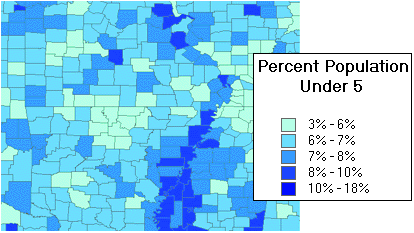
- NaturalBreaks—The following map illustrates classes divided by the Jenks method into natural intervals. Since 6 to 8 percent of the population is infants under age 5, this range has been split into two classes. Conversely, in only a few areas are infants more than 10 percent of the population; hence, one class covers 10 to 18 percent.
-
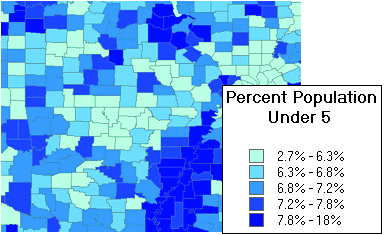
- Quantile—The following map illustrates classes that contain equal numbers of features from the quantile classification.
-
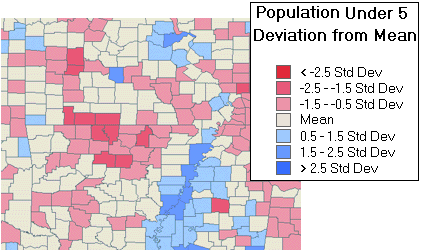
- StandardDeviation—The following map shows classes generated by the standard deviation classification. The class breaks are generated by successively adding or subtracting the standard deviation from the mean. A two-color ramp helps emphasize values above (shown in blue) and below (shown in red) the mean.
Number format
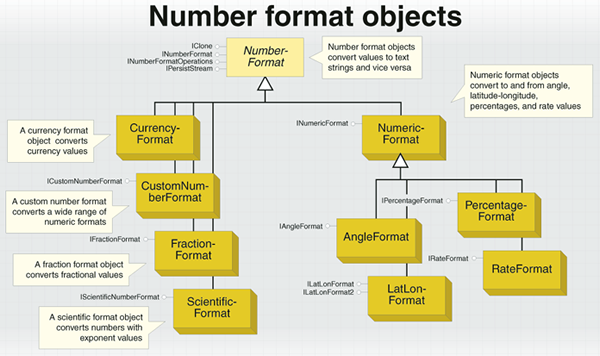
The number format objects convert numerical values into strings and strings into numerical values. How this conversion takes place is dependent on which coclasses are used and the property settings of the interfaces on those classes. The number format objects are shown in the following illustration:
