Disponible avec une licence Geostatistical Analyst.
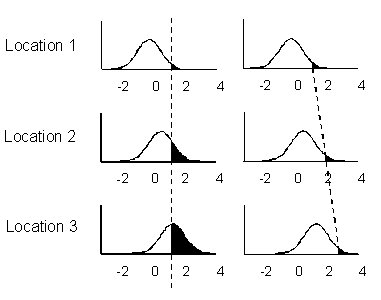
Kriging and cokriging are prediction methods, and the ultimate goal is to produce a surface of predicted values. You would also want to know how good the predictions are. Three different types of prediction maps can be produced, and two of them have standard errors associated with them. You can organize the kriging methods by the models; here they're organized by their goals. Consider the following figure, in which predictions at three locations are assumed normally distributed:

The prediction will be in the center of each curve, and a prediction map can be produced for the whole surface. Looking at the three figures on the left, if you want to predict the probability that the value is greater than a threshold value of 1, for example, it will be the area under the curve to the right of the dashed line. The prediction distribution changes for each location. Thus, when holding the threshold value constant, a probability map is produced for the whole surface. Looking at the three figures on the right, if you want to predict the quantile with 5 percent of the probability to the right, it will be the value at the dashed line (taken from the x-axis). Again, the prediction distribution changes for each location. Thus, when holding the probability constant, a quantile map is produced for the whole surface. Standard error maps can be produced for prediction and probability maps. The various methods and output maps, along with major assumptions, are given in the following table:
| Kriging and cokriging | Predictions | Prediction standard errors | Quantile maps | Probability maps | Standard errors of indicators |
|---|---|---|---|---|---|
Ordinary | X | X | X* | X* | |
Universal | X | X | X* | X* | |
Simple | X | X | X* | X* | |
Indicator | X | X | |||
Probability | X | X | |||
Disjunctive | X** | X** | X** | X** | |
Empirical Bayesian | X | X | X* | X* | |
Areal interpolation | X | X |
* Requires assumption of multivariate normal distribution
** Requires assumption of pairwise bivariate normality
Vous avez un commentaire à formuler concernant cette rubrique ?