获得 Business Analyst 许可后可用。
摘要
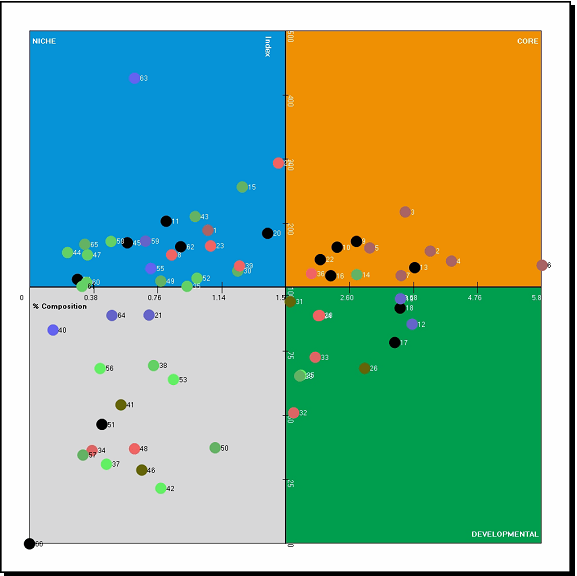
Divides segments into four quadrants based on percent composition and index. Use this chart to identify core, developmental, and niche target groups.
插图

用法
To best determine what your Index and Percent Composition axes values should be, you should analyze the output from the Customer Tapestry Profile Report.
In most cases, the Index axis should be set to a value of at least 100.
The Percent Composition axis should be set so you have at least three segments in the core target group. Often, there will be a natural break in the percent composition values.
Usually, the target profile is based on customer records.
The base segmentation profile can be generated using the Create Profile By Area Summation tool.
Customers in the target profile should be wholly contained within the base profile.
If you are unclear about what to use as the base profile, you can use the whole United States.
The segmentation layer should be set to the block group level for this map.
The segmentation base can be generated using total adult population or total households.
Total adult population includes individuals 18 years old or older.
You can drag and drop the chart axes to adjust Index and Percent Composition axes values.
语法
GamePlanChart_ba (BaseProfileParameterName, TargetProfileParameterName, IndexThreshold, PenetrationThreshold, TargetGroup, TitleParameterName, OutputDirectoryParameterName, {ReportFormats})| 参数 | 说明 | 数据类型 |
BaseProfileParameterName | The base profile used in the calculation of the index and percent penetration. This profile is usually based on the geographic extent of your customers. | Folder |
TargetProfileParameterName | The target profile that will be compared to the base profile. Typically, this is based on your customers and is generated using the Segmentation Profile tools. | Folder |
IndexThreshold | The value used to determine the threshold index of your analysis. | Double |
PenetrationThreshold | Defines the percentage of customers that meets or exceeds the percent composition threshold. | Double |
TargetGroup | The Tapestry Segmentation target group that contains the segments to be used in the Game Plan Chart. | String |
TitleParameterName | Title for the report. | String |
OutputDirectoryParameterName | The output directory that will contain the report. | Folder |
ReportFormats (可选) | Select the desired report output format
| String |
代码示例
GamePlanChart example (stand-alone script)
# Name: GamePlanChart.py
# Description: Creates a game plan chart for a profile of customers in San Francisco.
# Author: Esri

# Import system modules
import arcview
import arcpy

arcpy.ImportToolbox(r"C:\Program Files (x86)\ArcGIS\Desktop10.6\Business Analyst\ArcToolbox\Toolboxes\Business Analyst Tools.tbx")

try:
# Acquire extension license
  arcpy.CheckOutExtension("Business")

# Define input and output parameters for the Game Plan Chart tool
  BaseSeg = "San Francisco Area Profile"
  TargetSeg = "Profile_0"
  OutPath = "C:/temp/Output_Segmentation"

# Create Game Plan Chart
  arcpy.GamePlanChart_ba(BaseSeg, TargetSeg, "Game_Plan_Map", OutPath)

# Release extension license
  arcpy.CheckInExtension("Business")

except:
  print arcpy.GetMessages(2)
环境
此工具不使用任何地理处理环境。
许可信息
- ArcGIS Desktop Basic: 需要 Business Analyst
- ArcGIS Desktop Standard: 需要 Business Analyst
- ArcGIS Desktop Advanced: 需要 Business Analyst