获得 Production Mapping 许可后可用。
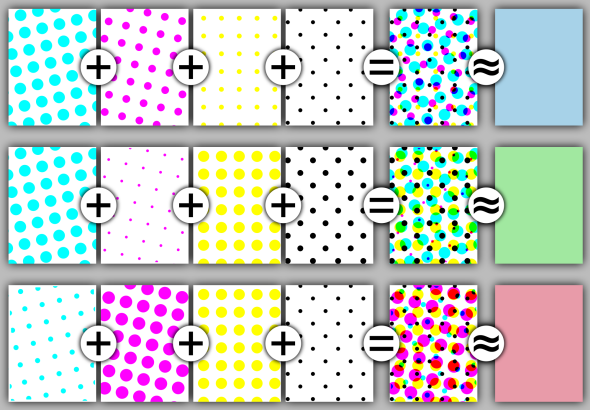
In lithographic print production, graphics are reproduced on paper using a series of very small dots of a single color. A series of uniquely colored dots are typically used to produce an image, like a map, on paper. These dots are typically not distinguishable to the naked eye and therefore appear as a solid color when viewed on paper. These unique single colors are sometimes referred to as separations (or plates or inks). A map with many colors and shades is printed by overlapping a series of these tiny colored dots (separations) in a particular pattern to produce the visual effect of a series of continuously colored areas. To change how the color appears on the paper, the dots' pattern can be varied in the size, shape, or spacing of the dots.
The following image illustrates an example of CMYK separations, from left to right: the cyan separation, the magenta separation, the yellow separation, the black separation, the combined halftone pattern, and finally how the human eye observes the combined halftone pattern from a sufficient distance. Spot color separations also work in the same way.

Separations are an advanced print production feature and may not be required to be set before the PDF file is given to the offset printing hardware or software. Therefore, the separation values written by Production PDF may not display in many common PDF viewing applications. Check with the offset printing vendor that will be printing the map to confirm if and what settings should be used. Production PDF creates In-RIP separations. In-RIP separations allow the RIP (raster image processor) to perform the separation tasks. This separation method often takes less time than creating host-based separations. However, a PostScript Level 3-supported output device with In-RIP separation capability is required.
Separation settings can be configured using the Separations Settings dialog box.
- 启动 ArcMap。
-
On the main menu, click File > Export Map.
The Export Map dialog box appears.
- Click the Save as type drop-down arrow and choose Production PDF.
- Click the Production tab.
- Click Map Colors.
The Color Mapping Rules dialog box appears.
- In the Color Mapping Rules dialog box, configure the color mapping rules to use when printing.
- Click Separation Settings.
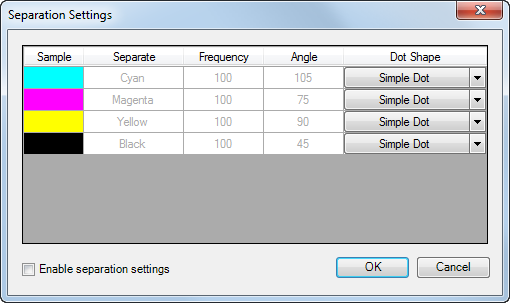
The Separation Settings dialog box appears.

- Check the Enable Separation Settings check box to modify the setting properties.
This will also save your properties to your settings file if you click Save Settings at the end of this workflow.
- Double-click the Frequency cell in any of the rows to type in a new frequency value.
- Double-click the Angle cell in any of the rows to type in a new angle value.
It is common to have a 15 percent difference between any other separation angle value. If CMYK separations will not be used, their angle values can be used for spot separations.
- Double-click the Dot Shape cell in any of the rows to select one of the predefined dot shapes.
- If necessary, repeat steps 9 through 11 for each listed separation.
- Click OK on the Separation Settings dialog box.
- Click OK on the Color Mapping Rules dialog box.
- Optionally click Save Settings.