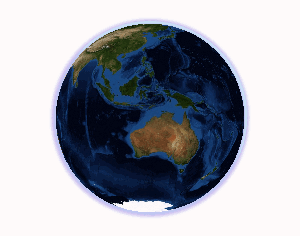
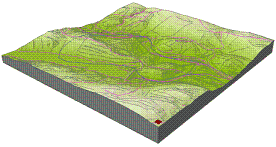
Available with 3D Analyst license.
ArcGIS offers two 3D visualization environments in which to work—ArcGlobe and ArcScene—which allow you to display, analyze, and animate your 3D or 2D data in a 3D space.
ArcGlobe
ArcGlobe is part of the ArcGIS 3D Analyst extension. This application is generally designed to be used with very large datasets and allows for seamless visualization of both raster and feature data. It is based on a global view, with all data projected into a global Cube projection and displayed at varying levels of detail (LODs), organized into tiles. For maximum performance, cache your data, which will organize and copy the source data into tiled LODs. Vector features are generally rasterized and displayed according to their associated LOD, which assists in very fast navigation and display.

ArcScene
ArcScene is a 3D viewer that is well suited to generating perspective scenes that allow you to navigate and interact with your 3D feature and raster data. Based on OpenGL, ArcScene supports complex 3D line symbology and texture mapping as well as surface creation and display of TINs. All data is loaded into memory, which allows for relatively fast navigation, pan, and zoom functionality. Vector features are rendered as vectors, and raster data is either downsampled or configured into a fixed number of rows/columns you set.

Main differences between ArcGlobe and ArcScene
Projected data
ArcGlobe projects all data onto a globe-shaped surface using one particular coordinate system—Cube Projection. All data added to an empty ArcGlobe document is projected on the fly to this coordinate system. Data that does not have projection information associated with it cannot be added into ArcGlobe. Being spherical, this application is optimized for visualizing geography at a global scale. It also renders a representation of the surface of the earth more realistically than other projections.
ArcScene projects all data in an ArcScene document according to the first layer added to the document. Usually, a planar projection, ArcScene is geared for those with smaller spatial datasets who want to examine a defined study area.
Cached data vs. memory management
One of the most significant differences between ArcGlobe and ArcScene is how each application handles information management. Since ArcGlobe is designed to be used with very large datasets, you should cache your data for optimum performance. The process of caching indexes and organizes all your data into tiles and levels of detail. This allows for fast display and visualization as you zoom in and out, pan around, and navigate to different places in your ArcGlobe document.
Learn more about cache management in ArcGlobe
ArcScene loads all data into available memory and uses paging files if necessary. This is one of the reasons why ArcScene is optimized for smaller study areas with less amounts of data.
Analysis
ArcGlobe is an excellent application for visualizing large, global data. It has very good performance at navigation and rendering high- and low-resolution raster and vector data. However, ArcScene is better optimized for analysis. The 3D Analyst toolbar is fully supported in ArcScene, as are triangulated irregular network (TIN) surfaces. ArcScene renders subsurface data and volumes very well. ArcGlobe supports the terrain dataset, but ArcScene does not. All the geoprocessing tools are available in both applications.
Viewing and display
In ArcGlobe, you have the option of displaying vector data as rasterized on the surface layer or rendering it as a vector layer with independent properties from the surface layer. This option is particularly useful with annotation feature classes, which can be draped on the surface or automatically billboarded to face the viewer. In ArcScene, vectors remain in their native format and can float independently of the raster surface. You have control over the amount of downsampling that occurs with the raster data in ArcScene. Annotation features cannot be displayed in ArcScene.
Another difference between the two applications is the ability of ArcScene to support stereo viewing. Stereo viewing is a great way to enhance the 3D visualization experience.
Learn more about viewing in stereo in ArcScene
Viewing over remote desktop
3D applications often rely heavily on a graphics card's GPU (graphics processing unit) to support rendering. A server running a virtualized desktop environment cannot leverage a graphics card in the same way your local desktop can. As a result, Esri has disabled the ability to run ArcGlobe over remote desktop.
If you attempt to launch ArcGlobe (or any other Globe Control based application, such as ArcGIS Explorer or ArcReader) through remote desktop, you will receive a pop-up notification that this ability has been disabled.
Although ArcScene is enabled for remote desktop access, performance can be very limited. If you need to access an ArcScene session remotely, it is recommended that you use a VPN (Virtual Private Network) access instead.
Examples of choosing the 3D display environment
Example 1—Presenting a county relief map
Data: You have detailed data for the entire county. Your data includes a series of aerial photographs, road centerlines, parcel boundaries, building footprints, land-use regions, and points of interest. For elevation data, you have a number of tiled DEM rasters that cover the entire county.
Goal: To visualize the county in three dimensions for promotional purposes, such as images for brochures and animations for videos.
Environment: ArcGlobe is the best choice because of the following:
- The data volume is high and would most likely require caching to be used at full resolution.
- The extent covers a wide region where curvature of the earth may come into play.
- You have a series of DEM tiles that you would like treated as a seamless elevation source.
Example 2—Investigating local mining data
Data: Most of your data is within one square mile around a group of oil wells. You have an aerial photograph, 3D polylines for the vertical drill paths, multipatch data for underground salt domes, and 2D lines for the outgoing oil pipelines. You also have a raster DEM for about 10 square miles around the wells.
Goal: To visualize the oil wells in three dimensions to see the effectiveness and coverage of your bores.
Environment: ArcScene is the best choice for these reasons:
- The data volume is small.
- The visualization is limited to a small extent.
- You want to see the data as though it has been sliced out of the ground.
Example 3—Building a virtual city
Data: You have building footprints, road centerlines, park areas, and transportation infrastructure data for a city, based on a prediction model for 15 years in the future. You also have a TIN for elevation relief.
Goal: To create an interactive environment for general display and analysis.
Environment: ArcGlobe and ArcScene are both viable choices because of the following:
- The data is not excessive in volume.
- Both applications support the applicable symbology options.
- Both applications support graphics for 3D view adornment, such as 3D trees, cars, and street furniture.
- Both applications support TIN data as an elevation source.
Example 4—Running a line-of-sight analysis for placement of a forestry fire watchtower
Data: You have raster data for elevation, vegetation type, and fire risk. You also have vector data for the fire road network and streams.
Goal: To identify the best candidate locations for placing a forestry fire watchtower.
Environment: ArcMap is the best choice for these reasons:
- You will be creating many raster surfaces, some temporary, as you run geoprocessing tools and models.
- You do not gain anything by interactively seeing the analysis results in 3D.
- You can easily copy final raster and vector data layers into ArcGlobe or ArcScene when the analysis is complete.
Functional differences between ArcGlobe and ArcScene
Functional differences
This is a sampling of some of the more significant functional differences between ArcGlobe and ArcScene.
Functional differences between ArcGlobe and ArcScene
Description | ArcGlobe | ArcScene |
3D Analyst Toolbar (contour, steepest path, line of sight, profile, and so on) | Not supported | Supported |
Supported | Not supported | |
Not supported | Supported | |
Dynamic hillshading (layer properties symbology and rendering display options) | Not supported | Supported |
Supported | Not supported | |
Not supported | Supported | |
VRML support | Can import | Can import/export |
Not supported | Supported | |
Not supported | Supported | |
Not supported | ||
Supported | Not supported | |
Supported | Not supported | |
Running the application over remote desktop | Not supported | Supported, but not recommended |