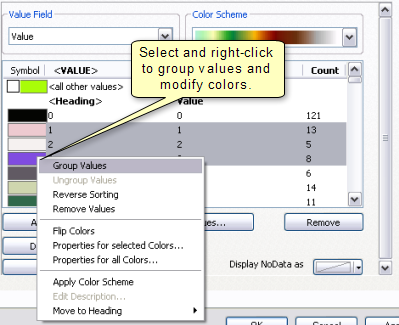
The Unique Values renderer is used to display each value in the raster layer using a random color. For instance, you might have discrete categories representing particular objects on the earth's surface, such as those in a thematic raster layer, which could display soil types or land use. If your data has a color map, you can use the Colormap renderer to display your data with assigned colors.
All renderers have an Import  button. Click this button to import symbology from a raster layer file (*.lyr) or a raster layer that is currently in the table of contents. The current renderer must match the renderer of the imported layer.
- In the table of contents, right-click the raster layer that you want to draw showing unique values, and click Properties.
- Click the Symbology tab.
- Click Unique Values.
- If the raster has a value attribute table, click the Value Field drop-down arrow and click the field you want to map.
If this control is disabled, it indicates that apart from the value field specifying the value for each cell, there are no additional fields you can use as unique values to render this layer. For example, your layer's data source may be a floating-pointing grid.
- Click the Color scheme drop-down arrow and click a color scheme.
Optionally, right-click the color scheme to
- Toggle between a graphic view and text view.
- Open the Properties to modify specifics about how the color scheme is generated.
- Save the color scheme.
- Optionally, click Default Colors to revert to the colors displayed by default when the layer was first added.
- Optionally, click a row under the Label field to enter a different description.
- You can modify the values in the legend table by clicking:
- Add All Values—Adds all available values to the legend table.
- Add Values—Allows you to select specific values to add to the legend table.
- Remove—Removes a selected row (value) from the legend table, to limit your map to a defined set of values.
- By right-clicking and modifying one or more selected fields.

- Optionally, click Colormap to either import a color map or export a color map.
- Optionally, click the Display NoData as button to symbolize the NoData using a color.
- Click OK.