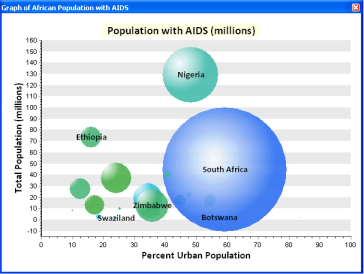
Bubble graphs are like scatterplot graphs, except that they allow an additional size variable to be incorporated into the graph. Essentially this is like charting three variables in two dimensions. The bubbles are represented by markers that vary in size, indicating relative importance.
In the example below, three variables—Total Population (y-axis), Percentage of Urban population (x-axis), and Population with AIDS (size of bubble)—are graphed.

- Click the View menu, point to Graphs, then click Create Graph
 .
.
- Click the Graph type drop-down arrow and choose Bubble
 .
.
In a bubble graph, all three values (variables) are independent. You can choose which variable to show on the x-axis, which to show on the y-axis, and which to show by the size of the bubble.
- Click the Layer/Table drop-down arrow and choose the layer or table containing the data values that are to be graphed.
- Click the Radius Field drop-down arrow and choose the field to represent the size of the bubble. Note that this value determines the size of the bubble relative to the other data points on the graph.
- Click the Y field drop-down arrow and choose the field of values to graph.
- Click the X field (Optional) drop-down arrow (if you want to supply an x-value) and choose the field to graph.
- X label field lets you specify a different field to label the horizontal axis of the bubble graph.
- By default, the values of the input data are added to the legend of the graph. You can disable this by unchecking the Add to legend check box.
- To mark the data points with their values, check the Show labels (marks) check box. If X label field has not been set, the Y field value is used for the label value. You can change the field used to label the points by changing the X label field value.
- You can change the appearance of the markers on the graph with the Color control.
- You can change the appearance, such as transparency, of the bubbles in the bubble graph with the Bubble tab.

The Border tab controls the width, style, and color of the outline of the bubble.
- Click the Next button to proceed to the general properties page to complete your graph.