- Engine
- ArcGIS for Desktop Basic
- ArcGIS for Desktop Standard
- ArcGIS for Desktop Advanced
- Server
Additional library information: Contents, Object Model Diagram
See the following sections for more information about this namespace:
- About the Carto library
- Map and page layout
- Map elements
- Map surrounds
- Map grids
- Renderers
- Labeling
- Annotation
- Dimensions
- Layers
- MapServer
- ArcIMS layers, symbols, and renderers
- GPS support
About the Carto library
The Carto library supports the creation and display of maps. ArcGIS applications show maps in the data and layout view. The data view shows data from one map and the page layout view can display multiple maps and associated marginalia. See the following screen shot:
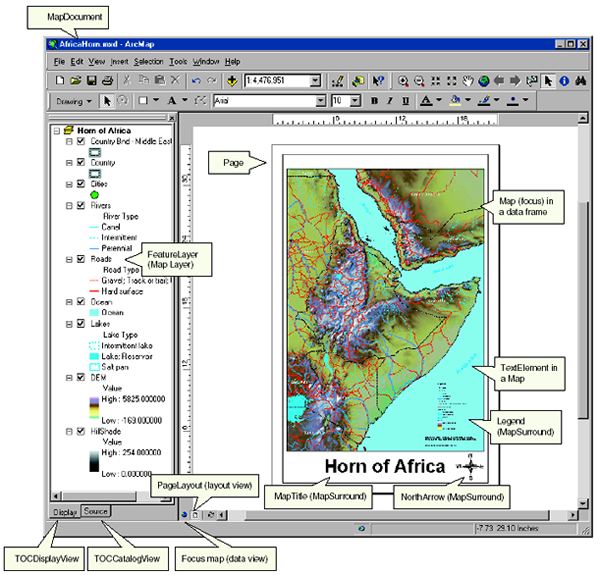
Use the Map object to access the map in the data view and the data it contains and the PageLayout object to manage the map in the layout view and the map surrounds. Although developers can use the Map or PageLayout objects in applications, it is more common for developers to use a higher level object, such as the MapBean or PageLayoutBean components. These higher level objects simplify some tasks, although they always provide access to the lower level Map and PageLayout objects allowing the developer control of the objects.
The PageLayout object is a container for hosting one or more maps and associated marginalia—north arrows, legends, scale bars, and so on. The Map object is a container of layers. The Map object has properties that operate on all layers in the map—spatial reference, map scale, and so on, along with methods that manipulate the map's layers.
There are many different types of layers that can be added to a map. Different data sources often have an associated layer responsible for displaying the data on the map—vector features are handled by the FeatureLayer object, raster data by the RasterLayer object, triangulated irregular network (TIN) data by the TinLayer, and so on. Layers can, if required, handle all the drawing operations for associated data but it is more common for layers to have an associated Renderer object. The properties of the Renderer object control how data displays in a map. Renderers use symbols from the Display library for the drawing—the renderer matches a particular symbol with the properties of the entity that is to be drawn.
The Map and PageLayout objects are not the only objects in the Carto library that expose the behavior of map and page drawing. The MxdServer and MapServer objects support the rendering of maps and pages, but instead of rendering to a window, these objects output to a file.
Using the MapDocument object, developers can persist the state of the map and page layout in a map document (.mxd), which can be used in one of the ArcGIS controls (MapBean or PageLayoutBean).
A map and a page layout can contain elements. An element has a geometry to define its location on the map or page, along with behaviors that control the display of the element. There are elements for basic shapes, text labels, complex marginalia, and so on. The Carto library also contains support for map annotation and dynamic labeling.
The Carto library is commonly extended in a number of areas. Custom renderers, layers, and so on, are common. A custom layer is often the easiest method of adding custom data support to a mapping application.
Map and page layout
The Map object is a container for map data and manages layers of features and graphic data. The Map object is a primary point for customization tasks because it not only manages layers of data, but it is also a view and has to manage the drawing of all its data. Typical tasks with the Map object include adding a new layer, panning the display, changing the view extent (zooming functions), changing the spatial reference, and getting the selected features and elements. See the following illustration:
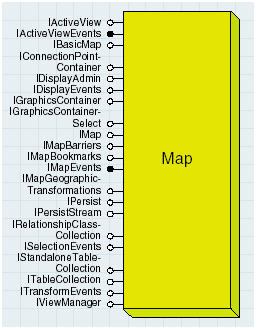
The Map object is creatable so that new Map objects can be created and added to the document. Instantiating a new Map object automatically creates the following related objects on which it relies:
- ScreenDisplay object that every view uses to manage the drawing window
- New CompositeGraphicsLayer
IMap interface
The IMap interface is a starting point for many of the tasks you can do with a map. For example, you can use IMap to add, delete, and access map layers containing data from various sources, including feature layers and graphics layers; associate map surround objects (legends, scale bars, and so on) with the map; access the various properties of a map, including the area of interest, the current map units and the spatial reference; select features and access the Map object's current selection.
Focus map
Every map document contains at least one Map object. Only one map can have focus at a time (focus map). MapDocument provides access to all of the Map objects loaded in the document; MapDocument.GetActiveView.GetFocusMap returns a reference to the map with focus and MapDocument.GetMap(i) returns the specific Map object. A map document can contain any number of Map objects—the focus map always represents the data view. See the following code example:
[Java]
MapDocument mapDoc = new MapDocument();
mapDoc.open("C:/Test.mxd", null);
IMap focusMap = mapDoc.getActiveView().getFocusMap();
//Iterate through all the maps.
IMap map = null;
for (int i = 0; i < mapDoc.getMapCount(); i++)
    map = mapDoc.getMap(i);
Accessing the map's layers
The Map object manages a collection of layer objects. Types of layer objects include FeatureLayer, FDOGraphicsLayer, and GroupLayer.
Each layer has a spatial reference. A spatial reference defines a precision and a coordinate system. The map coordinate system is automatically set to the coordinate system of the first layer loaded in the map and the precision is calculated based on the union of all the layers' extents.
The following code example shows how to add a layer based on a shapefile to the map:
[Java]
/*
 * In this code, the file extension, .shp is not used when specifying
 * the name of the shapefile to be opened.
 */
public void openShapefile(String workspacePath, String shapefileName){
    try{
        ShapefileWorkspaceFactory wsf = new shapefileWorkspaceFactory();
        Workspace work = new Workspace(wsf.openFromFile(workspacePath, 0));
        IFeatureClass featureClass = work.openFeatureClass(shapefileName);
        FeatureLayer layer = new FeatureLayer();
        layer.setFeatureClassByRef(featureClass);
        layer.setName(featureClass.getAliasName());
        //MapBean is the Java visual bean that can only contain one Map object at a time.
        //Add the layer to the current map.
        mapBean.addLayer(layer, 0);
    }
    catch (Exception e){
        e.printStackTrace();
    }
}
Selecting in the map
From the Map object, you can find out about the selected features in the map. See the following code example:
[Java]
public void getSelectedFeature(){
    try{
        IMap map = mapBean.getMap();
        ISelection selection = map.getFeatureSelection();
        IEnumFeature enumFeature = (IEnumFeature)selection;
        enumFeature.reset();
        IFeature feature = enumFeature.next();
        while (feature != null){
            System.out.println("FEATURE ID: " + feature.getOID());
            feature = enumFeature.next();
        }
    }
    catch (Exception e){
        e.printStackTrace();
    }
}

End Sub
The Map object also contains methods to select features. The following code example shows how to select features by shape. You can use this code in the mouse down event of a custom tool. The HookHelper object helps you get a handle to the FocusMap and the ActiveView.
[Java]
public void onMouseDown(int button, int shift, int x, int y){
    try{
        IMap map = hookHelper.getFocusMap();
        RubberEnvelope rubberEnv = new RubberEnvelope();
        //Flag the area of the old selection to invalidate.
        hookHelper.getActiveView().partialRefresh
            (esriViewDrawPhase.esriViewGeoSelection, null, null);
        //Use the TrackNew method to prompt users to drag a square on the display.
        IGeometry geom = rubberEnv.trackNew(hookHelper.getActiveView()
            .getScreenDisplay(), null);
        //Perform the selection.
        map.selectByShape(geom, new SelectionEnvironment(), false);
        //Flag the area of the new selection to invalidate.
        hookHelper.getActiveView().partialRefresh
            (esriViewDrawPhase.esriViewGeoSelection, null, null);
    }
    catch (Exception e){
        e.printStackTrace();
    }
}
Drawing on the map's graphics layers
The basic graphics layer is the default graphics layer of the map where all graphics are drawn by default. Map provides direct access to this layer with the method IMap.GetBasicGraphicsLayer.
You can also access the Map object through the IGraphicsContainer interface to access its active graphics layer. This always returns a reference to the map's active graphics layer.
The map's basic graphics layer is a graphics layer on which to draw and the composite graphics layer that contains all the map's graphic layers. Map's basic graphics layer cannot be deleted from the CompositeGraphicsLayer object. Get a reference to the map's basic graphics layer through the ICompositeGraphicsLayer interface to manage the layer it contains. This way, graphics layers can be added to or deleted from the map.
The layer collection returned from the IMap.GetLayers method does not include the graphics layers managed by the map's CompositeGraphicsLayer. To access them, you can use the IMap.GetActiveGraphicsLayer property. This property returns a reference to the graphics layer which is the current drawing target. This can be the basic graphics layer, a layer in the map's CompositeGraphicsLayer, or a feature layer, such as an FDOGraphicsLayer.
The following code example adds a new graphics layer to the map. If you run this program and view the the Annotation groups tab of the data frame properties, you will see a new group, that is, a new graphics layer in the list. To draw in this new layer, make it the active graphics layer (set the ActiveGraphicsLayer property of the map).
[Java]
IMap focusMap = mapDoc.getActiveView().getFocusMap();
ICompositeGraphicsLayer layer = (ICompositeGraphicsLayer)
    focusMap.getBasicGraphicsLayer();
IGraphicsLayer graphicLayer = layer.addLayer("New Graphics Layer", null);
map.setActiveGraphicsLayerByRef((ILayer)graphicLayer);
In the following code example, query interface (QI) from IMap to IGraphicsContainer to add a text element to the active graphics layer. For more on elements, see the Map elements section in this topic.
[Java]
IMap focusMap = mapDoc.getActiveView().getFocusMap();
IGraphicsContainer container = (IGraphicsContainer)focusMap;
TextElement textElement = new TextElement();
Point point = new Point();
point.setX(0);
point.setY(0);
textElement.setGeometry(point);
textElement.setText("Hello world");
container.addElement(textElement, 0);
The basic graphics layer is a special layer that cannot be deleted and is not reported in the CompositeGraphicsLayer's layer count. Further, this layer's element count reports the total number of elements in all the layers of the CompositeGraphicsLayer's. If you delete all elements in the map's basic graphics layer, you delete all elements in all target layers (annotation groups) in the CompositeGraphicsLayer. In the case where the Map's CompositeGraphicsLayer does have multiple layers, use IMap.GetActiveGraphicsLayer to set or get a reference to the active layer.
The active graphics layer does not always reference a layer in the map's CompositeGraphicsLayer; this is the case when a database layer containing elements is set as the active graphics layer—a good example of this is the feature-linked annotation layer (FDOGraphicsLayer).
The map's IGraphicsContainer always returns a reference to the map's active graphics layer. Again, this can be the basic graphics layer, a layer in the map's CompositeGraphicsLayer, or a feature layer, such as an FDOGraphicsLayer. See the following illustration:
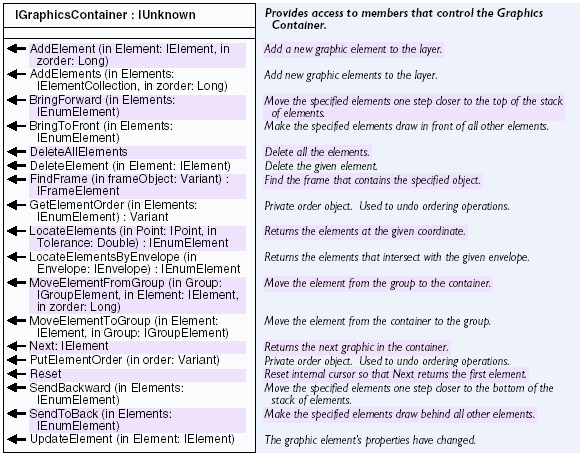
For more information, see the description of the IGraphicsContainerSelect interface under the Page layout section in this topic.
Map frames and surrounds
In ArcGIS, Map objects are always contained by MapFrame objects. The PageLayout object manages the MapFrame objects and each MapFrame manages a map. For convenience, the MapDocument and HookHelper object can provide a handle to the focus map; however, the PageLayout object manages these.
MapSurround objects are elements related to a map. Types of MapSurround objects include legends, north arrows, and scale bars. The Map object exposes several properties and methods for accessing the map surrounds associated with it. All map surrounds are contained by a MapSurroundFrame, which like a MapFrame, is ultimately managed by the PageLayout object.
For more information on the map frame and surrounds, see the Page layout section in this topic.
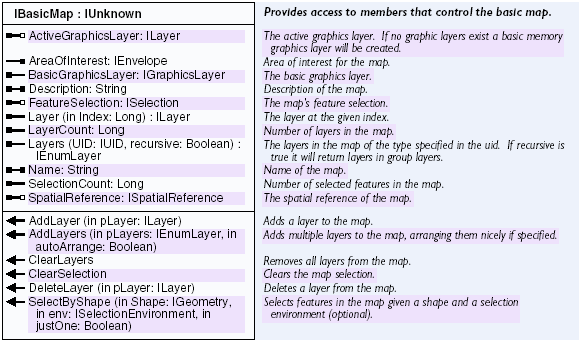
IBasicMap
IBasicMap is a subset of IMap that provides support for SceneBean and GlobeBean. The map (2D), scene (3D), and globe (3D) implement this interface. Components used by MapBean, SceneBean, and GlobeBean, utilize IBasicMap rather than IMap. See the following illustration:
Active view
The IActiveView interface controls the main application window, including all drawing operations. Use this interface to change the extent of the view, access the associated ScreenDisplay object, show or hide rulers and scroll bars, and refresh the view. Refreshing the view is discussed in detail in the Display library and in the help system for the Refresh and PartialRefresh methods of IActiveView. See the following illustration:
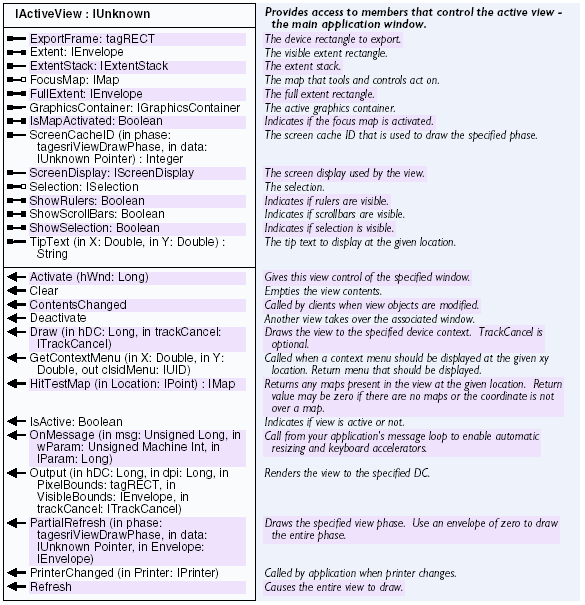
Use the following code example to zoom in the current active view:
public void zoomInCenter(){
    try{
        //Get the map document.
        IActiveView activeView = mapDoc.getActiveView();
        // activeView = (IActiveView)mapDoc.getPageLayout();
        IEnvelope env = activeView.getExtent();
        Point centrePoint = new Point();
        centrePoint.setX((env.getXMax() - env.getXMin()) / 2+env.getXMin());
        centrePoint.setY((env.getYMax() - env.getYMin()) / 2+env.getYMin());
        env.setWidth(env.getWidth() / 2); //resize envelope width
        env.setHeight(env.getHeight() / 2); //resize envelope height
        env.centerAt(centrePoint);
        activeView.setExtent(env);
        activeView.refresh();
    }
    catch (Exception e){
        e.printStackTrace();
    }
}
Active view events
The IActiveViewEvents interface is the default outbound interface on the Map object. It is exposed by the Map object so that clients can listen and respond to specific events related to the active view, such as AfterDraw and SelectionChanged. See the following illustration:
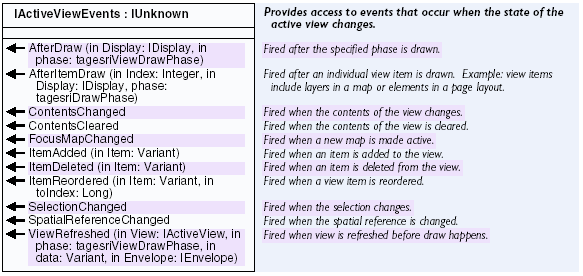
Many coclasses implement this interface and each fires events differently. The Map object's implementation of the IActiveView is different from the PageLayout object's implementation. For example, the Map object does not fire the FocusMapChanged event, whereas the PageLayout object does. Similarly, the Map object fires the ItemDeleted event when a layer is removed from the map and the PageLayout object fires the same event when elements, such as a map frame or graphic are deleted. The AfterViewDraw event will not fire unless IViewManager.VerboseEvents is set to true.
In the following code example, the OnSelectionChanged fires and the message is printed each time the selection is modified:
[Java]
try{
    mapBean.addIMapControlEvents2Listener(new IMapControlEvents2Adapter(){
        public void onSelectionChanged
            (com.esri.arcgis.controls.IMapControlEvents2OnSelectionChangedEvent e){
            System.out.println("onSelectionChanged()");
        }
    }
    );
}

catch (IOException e){
    e.printStackTrace();
}
IViewManager
IViewManager is a low level interface to the properties defining the behavior of the active view. See the following illustration:
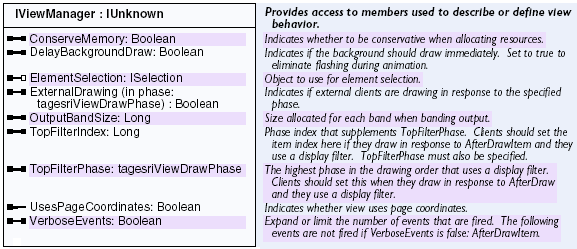
One commonly used method on the IViewManager interface is VerboseEvents. When VerboseEvents is set to false, the default, IActiveViewEvents.AfterItemDraw is not fired. To listen for this event, set VerboseEvents to true.
The following code example buffers each selected feature and draws the result on the display. The buffer polygons have a black outline and a slanted red line fill.
[Java]
Map map = (Map)mapBean.getMap();
//Set the verbose events.
map.setVerboseEvents(true);
//Create a fill symbol.
SimpleFillSymbol symbol = new SimpleFillSymbol();
RgbColor color = new RgbColor();
color.setRed(255);
symbol.setStyle(esriSimpleFillStyle.esriSFSForwardDiagonal);
symbol.setColor(color);
Polygon bufferedPolygon = null;

map.addIActiveViewEventsListener(new IActiveViewEventsAdapter(){
    public void afterDraw(IActiveViewEventsAfterDrawEvent event)throws IOException,
        AutomationException{
        //Draw in the geography phase.
        if (event.getPhase() != esriDrawPhase.esriDPGeography)return ;
        //Draw the buffered polygon.
        event.getDisplay().setSymbol(symbol); event.getDisplay().drawPolygon
            (bufferedPolygon);
    }

    public void selectionChanged(IActiveViewEventsSelectionChangedEvent arg0)throws
        IOException, AutomationException{
        GeometryBag bag = new GeometryBag(); IActiveView activeView =
            hookHelper.getActiveView(); IEnvelope lastBufferedExtent = null;
        //Flag the last buffered region for invalidation.
        if (lastBufferedExtent != null){
            activeView.partialRefresh(esriViewDrawPhase.esriViewGeography, null,
                lastBufferedExtent);
        }
        if (activeView.getFocusMap().getSelectionCount() == 0){
            //Nothing selected, don't draw anything.
            bufferedPolygon = null; return ;
        }
        //Buffer each selected feature.
        ISelection selection = activeView.getFocusMap().getFeatureSelection();
            IEnumFeature enumFeatures = (IEnumFeature)selection; enumFeatures.reset()
            ; IFeature feature = enumFeatures.next();
        while (feature != null){
            ITopologicalOperator operator = (ITopologicalOperator)feature.getShape()
                ; IPolygon poly = (IPolygon)operator.buffer(0.1); bag.addGeometry
                (poly, null, null); feature = enumFeatures.next();
        }

        //Union all the buffers into one polygon.
        bufferedPolygon = new Polygon(); bufferedPolygon.constructUnion(bag);
            lastBufferedExtent = bufferedPolygon.getEnvelope();
        //Flag new buffered region for invalidation.
        activeView.partialRefresh(esriViewDrawPhase.esriViewGeography, null,
            lastBufferedExtent);
    }
}

    ;
Barriers
Barriers are used by labeling engines to signal that a label should not be placed in a particular region. Barriers currently include annotation, graphical elements, and symbols generated from renderers. For example, a feature layer using a pie chart renderer doesn't want labels to appear directly above the pie chart's symbols. In this case, pie chart symbols act as barriers informing the label engine that no labels should be placed on top of them.
The IMapBarriers interface returns a list of all barriers and weights from all layers in the map. Layers with barriers include those layers that implement IBarrierProperties—CompositeGraphicsLayer, CoverageAnnotationLayer, and FDOGraphicsLayer. When creating a labeling engine, use this interface to access all barriers from all layers. See the following illustration:

Spatial bookmarks
All spatial bookmarks are managed by and are persisted in the Map object. Bookmarks save map extents with an identifying name making it easy to jump to a specific location on the map.
A map's bookmarks are managed by the IMapBookmarks interface. Use IMapBookmarks to access existing bookmarks, add new bookmarks, and delete old bookmarks. Once you have a reference to a particular bookmark, make the map's extent equal to that stored in the bookmark. See the following illustration:

There are two types of spatial bookmarks available in ArcObjects: Area of Interest bookmarks and Feature bookmarks. Area of Interest bookmarks store information about a map extent. Feature bookmarks allow you to find a particular feature on the map. For more information, ISpatialBookmark, IAOIBookmark, and IFeatureBookmark.
You can also use the ToolBarBean to add bookmarks.
The following code example shows one method for creating a new Area of Interest bookmark:
[Java]
public void addSpatialBookMark(){
    try{
        IActiveView activeView = mapDoc.getActiveView();
        Map map = (Map)mapDoc.getActiveView().getFocusMap();
        //Create a new bookmark.
        AOIBookmark bookMark = new AOIBookmark();
        //Set the extent.
        bookMark.setLocationByRef(activeView.getExtent());
        //Give the bookmark a name.
        bookMark.setName("Area Of Interest");
        //Add the bookmark to the map's bookmark collection.
        map.addBookmark(bookMark);
    }
    catch (Exception e){
        e.printStackTrace();
    }
}
The following code example shows how to find an existing spatial bookmark and zoom to its stored extent:
[Java]
public void zoomToMark(){
    try{
        IActiveView activeView = mapDoc.getActiveView();
        Map map = (Map)mapDoc.getActiveView().getFocusMap();
        IEnumSpatialBookmark bookmarks = map.getBookmarks();
        bookmarks.reset();
        ISpatialBookmark bookMark = bookmarks.next();
        while (bookMark != null){
            if (bookMark.getName().equals("Area Of Interest")){
                bookMark.zoomTo(map);
                //Zoom to bookmark.
                mapDoc.getActiveView().refresh();
            }
            bookMark = bookmarks.next();
        }
    }
    catch (Exception e){
        e.printStackTrace();
    }
}
Map events
The IMapEvents interface is exposed off the Map object, which enables clients to listen and respond to the FeatureClassChanged and VersionChanged events occurring inside a map. Both of these events are related to changing the version in which the map's layers are working. For example, if someone changes the version in which an edit session is working, the editor has to know about all the new feature classes to reset the snapping environment. See the following illustration:

The Map object's default outbound interface is IActiveViewEvents. Because Visual Basic handles one outbound interface per object, the MapEvents object has been created to give Visual Basic users a method for responding to the events grouped under IMapEvents.
The following code example shows how to listen to map events. The event is declared on the MapEvents object instead of the Map object. Paste the code into Visual Basic for Applications (VBA) and run the InitEvents procedure.
[Java]
Map map = (Map)mapDoc.getActiveView().getFocusMap();
map.addIMapEventsListener(new IMapEvents(){
    public void versionChanged(IMapEventsVersionChangedEvent arg0)throws IOException,
        AutomationException{
        System.out.println("Version Changed!");
    }
    public void featureClassChanged(IMapEventsFeatureClassChangedEvent arg0)throws
        IOException, AutomationException{
        System.out.println("FeatureClass Changed!");
    }

}

);
ITableCollection
The ITableCollection interface is used to manage tables associated with a map. Use this interface to add new tables to a map, remove old tables, or access a table already loaded. See the following illustration:

The following code example loads a table into the focus map:
[Java]
public void addTable(){
    try{
        Map map = (Map)mapDoc.getActiveView().getFocusMap();
        ITable table = openTable("C:/test/tabledata", "states.dbf");
        if (table == null)
            return ;
        // Map implements ITableCollection and thus map.addTable(table);
        mapDoc.replaceContents(map);
    }
    catch (Exception e){
        e.printStackTrace();
    }
}

public ITable openTable(String location, String name){
    ITable table = null;
    try{
        ShapefileWorkspaceFactory fact = new ShapefileWorkspaceFactory();
        IWorkspace works = fact.openFromFile(location, 0);
        IEnumDatasetName names = works.getDatasetNames(esriDatasetType.esriDTTable);
        names.reset();
        IDatasetName dataName = names.next();
        while (name != null){
            if (dataName.getName().equals(name))
                break;
        }
        IName data = (IName)dataName;
        table = (ITable)data.open();
    }
    catch (Exception e){
        e.printStackTrace();
    }
    return table;
}
Page layout
The PageLayout object corresponds to the layout view. You can access the PageLayout object via MapDocument.GetPageLayout. See the following illustration:
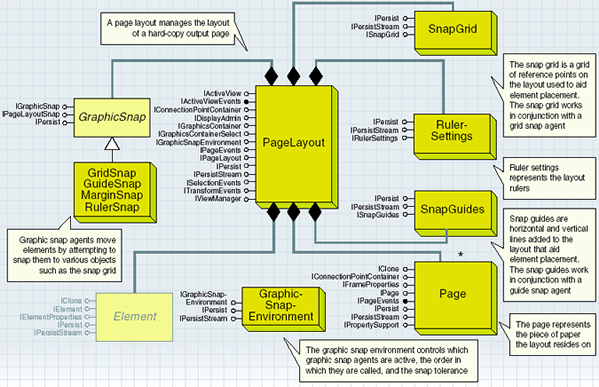
The PageLayout object is similar to the Map object. Both are views that take control of the main application window and both are graphics containers that can store graphical elements. If there is no map activated in layout view (MapDocument.GetActivatedView), all new graphic elements are added to the PageLayout object. If a map is activated, graphic elements are added to the focus map (MapDocument.getFocusMap). See the following illustration:
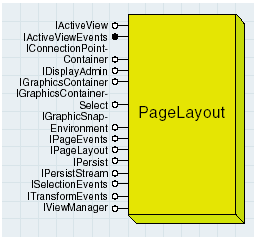
Although the PageLayout and Map objects are graphics containers, the type of graphics each stores is different. The PageLayout object can additionally store frame elements, such as a MapFrame and both can store graphic elements, such as a TextElement. Although the map document (MxDocument) can pass a reference to the focus map and the entire collection of maps in the document, the PageLayout object manages all Map objects via MapFrame objects. In ArcObjects, all Maps must be contained by a MapFrame element, which is directly managed by the PageLayout. It is only for convenience that map documents are able to pass a reference to maps.
To present itself as a hardcopy output page, the PageLayout automatically creates the SnapGuides, SnapGrid, RulerSettings, and Page objects.
IPageLayout interface
The IPageLayout interface is the primary interface implemented by the PageLayout object. Use this interface to access the RulerSettings, SnapGrid, SnapGuides, and Page objects. IPageLayout also has methods for zooming the view and changing the focus map. See the following illustration:
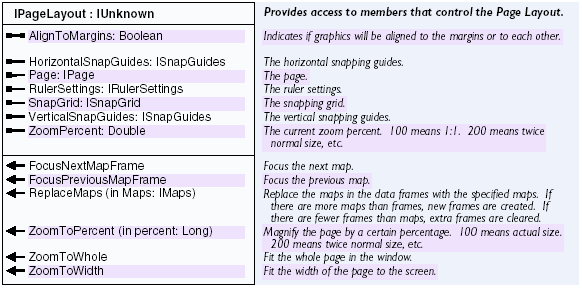
The following code examples shows zooming:
[Java]
public void zoomToPercent(){
    try{
        PageLayout layout = (PageLayout)mapDoc.getPageLayout();
        //Check the current active view.
        if (!layout.isActive()){
            layout.activate(mapBean.getHWnd());
        }
        layout.zoomToPercent(50);
        //Zooms to 50 percent.
    }
    catch (Exception e){
        e.printStackTrace();
    }
}
IGraphicsContainer
IGraphicsContainer provides access to the PageLayout object's graphic elements. Use this interface to add new elements or access existing ones. For example, a title at the top of a layout is a TextElement stored in the layout's graphics container. See the following illustration:
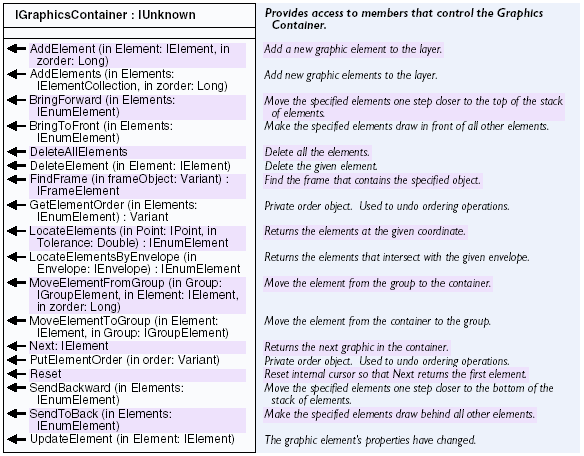
The following code example shows one method for adding a new text element to the page layout. In this example, a custom tool is used to get a mouse down event so users can place the text element anywhere on the page layout.
[Java]
public void onMouseDown(int button, int shift, int x, int y){
    try{
        IActiveView activeView = hookHelper.getActiveView();
        if (activeView instanceof IPageLayout){
            TextElement text = new TextElement();
            Point point = (Point)activeView.getScreenDisplay()
                .getDisplayTransformation().toMapPoint(x, y);
            text.setText("My TEXT");
            text.setGeometry(point);
            PageLayout layout = (PageLayout)mapDoc.getPageLayout();
            layout.addElement(text, 0);
            //Refresh the PageLayout graphics.
            activeView.partialRefresh(esriViewDrawPhase.esriViewGraphics, null, null)
                ;
        }
        else{
            System.out.println("USE THIS WITH PAGELAYOUTCONTROL...");
        }
    }
    catch (Exception e){
        e.printStackTrace();
    }
}
The following code example moves all the elements in the layout one inch to the right:
[Java]
public void moveAllElements(){
    try{
        IPageLayout layout = mapDoc.getPageLayout();
        //Loop through and move all the elements.
        IGraphicsContainer graphicsContainer = (IGraphicsContainer)layout;
        graphicsContainer.reset();
        IElement element = graphicsContainer.next();
        while (element != null){
            ITransform2D transform = (ITransform2D)element;
            transform.move(1, 0);
            element = graphicsContainer.next();
        }
        mapDoc.getActiveView().partialRefresh(esriViewDrawPhase.esriViewGraphics,
            null, null);
    }
    catch (Exception e){
        e.printStackTrace();
    }
}
Selecting graphics—IGraphicsContainerSelect
Most objects that are graphics containers, such as PageLayout and Map, implement the IGraphicsContainerSelect interface to expose additional members for managing their element selection. For example, IGraphicsContainerSelect.UnselectAllElements can be used to clear an object's graphic element selection. See the following illustration:
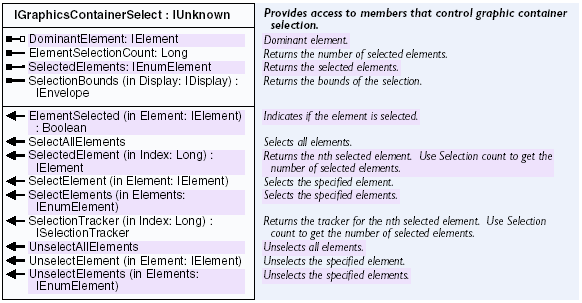
The following simple code example returns the number of elements currently selected in the focus map and page layout:
[Java]
public void graphicsSelectionCount(){
    try{
        IMap map = mapDoc.getActiveView().getFocusMap();
        IPageLayout layout = mapDoc.getPageLayout();
        IGraphicsContainerSelect containerSelection = (IGraphicsContainerSelect)
            layout;
        IGraphicsContainerSelect containerMap = (IGraphicsContainerSelect)map;
        System.out.println("MAP SELECTION: " + containerMap.getElementSelectionCount
            ());
        System.out.println("LAYOUT SELECTION: " +
            containerSelection.getElementSelectionCount());
    }
    catch (Exception e){
        e.printStackTrace();
    }
}
Page object
The PageLayout object automatically creates a Page object to manage the page of paper on which the layout resides. Aside from color, size, and orientation, the Page object manages additional layout properties, such as page units, border style, and printable bounds. Access the PageLayout's Page object via IPageLayout.GetPage. See the following illustration:
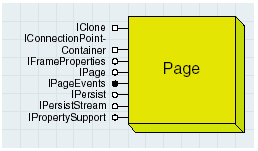
IPage interface
IPage is the primary interface on the Page object. Use this interface to access all of the properties of a MapDocument page, including the page's border, background, background color, orientation, and size. See the following illustration:
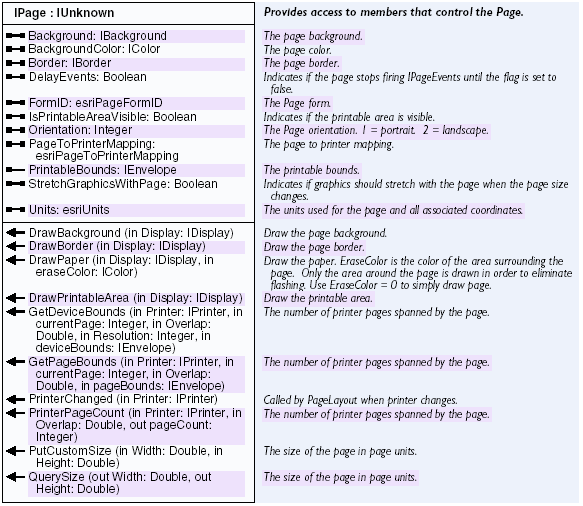
The following code example changes the size and color of the page:
[Java]
public void checkPageSize(){
    try{
        IPage page = mapDoc.getPageLayout().getPage();
        double[] width = {
            0
        };
        double[] height = {
            0
        };
        page.querySize(width, height);
        if (width[0] == 8.5 && height[0] == 11.0)
            page.putCustomSize(5, 5);
    }
    catch (Exception e){
        e.printStackTrace();
    }
}

public void changeColor(){
    try{
        IPage page = mapDoc.getPageLayout().getPage();
        RgbColor color = new RgbColor();
        color.setRed(255);
        color.setBlue(204);
        color.setGreen(255);
        page.setBackgroundColor(color);
    }
    catch (Exception e){
        e.printStackTrace();
    }
}
Standard page sizes
The esriPageFormID enumeration provides a convenient list of preselected page sizes for use by the Page object. For example, to change the layout to standard legal page size, pass in esriPageFormLegal to IPage.GetFormID (faster than setting a custom size with IPage.PutCustomSize). See the following illustration:
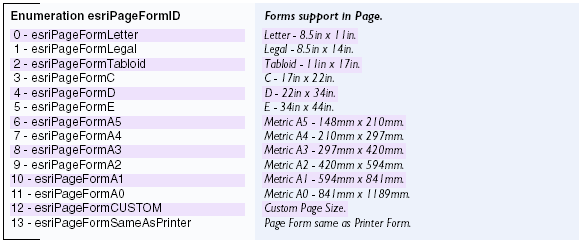
One important element in this enumeration is esriPageFormSameAsPrinter. When the FormID property has been set to this element, the layout's page size mimics the page size of the printer—when the printer page size changes, the layout's page size changes to match it.
The following code example uses the esriPageFormID enumeration to change the page size. It can be useful if you used the previous code example to change the page's size and color.
[Java]
public void setLegalSize(){
    try{
        IPage page = mapDoc.getPageLayout().getPage();
        double[] width = {
            0
        };
        double[] height = {
            0
        };
        page.setFormID(esriPageFormID.esriPageFormLegal);
        page.querySize(width, height);
        System.out.println("The Size now is: WIDTH: " + width[0] + " and Height: " +
            height[0]);
    }
    catch (Exception e){
        e.printStackTrace();
    }
}
Mapping page size to the printer
The esriPageToPrinterMapping enumeration formats the page when the layout's page size does not match the printer's page size. This is often the case when IPage.GetFormID is set to something other than esriPageFormSameAsPrinter. By default, ArcObjects crops the page, but you can choose to scale or tile the page. See the following illustration:

Page events
The Page object is the event source for page events. Page events are fired by the Page object to notify all clients that certain aspects of the page have changed. The page events—PageColorChanged, PageMarginsChanged, PageSizeChanged, and PageUnitsChanged—are grouped under the IPageEvents interface. In ArcObjects, there is only one client (PageLayout object) listening for these events. The PageLayout object listens for these events so it can modify its layout according to changes made to its page. For example, when page units are changed, the page layout needs to update its transformation, update the snap tolerance and snap grid, update its snap guides, and convert its graphics to the new units. See the following illustration:

Snap grid
The layout view supports a snap grid, which is a grid of reference points on the layout used to help position elements. See the following screen shot:
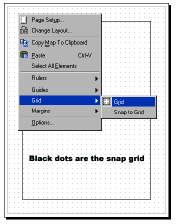
The grid can be used as a visual indicator of size and position or it can be used to snap elements into position. See the following illustration:

In layout view, right-click the screen and click Grid to show or hide the snap grid and enable or disable snapping to the grid. The SnapGrid object represents the snap grid. Although this object is cocreatable, there is no need to create one as the PageLayout object automatically creates one when it is created. Use IPageLayout.GetSnapGrid to get a reference to the snap grid currently associated with the layout view.
The SnapGrid implements IPersist and IPersistStream to save the object's current settings in the current map document. See the following illustration:

The primary interface on the SnapGrid object is ISnapGrid. Use this interface to change the grid's horizontal and vertical spacing and control whether or not the grid is visible.
The following code example changes the snap grid's vertical and horizontal spacing to 0.5 inches and ensures the grid is visible.
[Java]
public void snapGrid(){
    try{
        ISnapGrid snapGRID = mapDoc.getPageLayout().getSnapGrid();
        snapGRID.setHorizontalSpacing(0.5);
        snapGRID.setVerticalSpacing(0.5);
        snapGRID.setIsVisible(true);
        mapDoc.getActiveView().refresh();
    }
    catch (Exception e){
        e.printStackTrace();
    }
}
Snap guides
You can use rulers, guides, and grids in layout view to align elements on the page. The following screen shot shows a vertical and horizontal snap guide added to the layout.
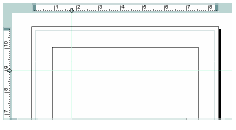
The PageLayout object has two SnapGuides objects—one for managing horizontal guides and one for managing vertical guides. Use IPageLayout.SetVerticalSnapGuides or IPageLayout.SetHorizontalSnapGuides to obtain a reference to the desired SnapGuides object. See the following illustration:

Each SnapGuides object manages an internal collection of individual guides. For example, the SnapGuides object that represents the horizontal snap guides can contain 10 guides.
Use ISnapGuides to add a new guide, remove a guide, and turn the visibility of the guides on or off. See the following illustration:
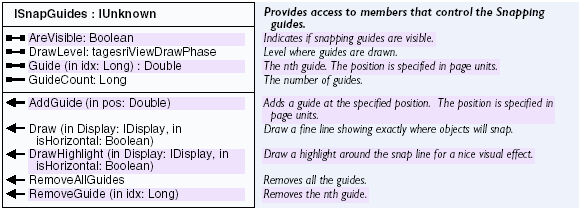
The following code example adds a new horizontal guide five inches from the bottom of the page and turns on the horizontal guides' visibility if they are turned off:
[Java]
public void addHorizontalSnapGrid(){
    try{
        ISnapGuides horizSnapGuides = mapDoc.getPageLayout().getHorizontalSnapGuides
            ();
        horizSnapGuides.addGuide(5);
        if (!horizSnapGuides.isAreVisible()){
            horizSnapGuides.setAreVisible(true);
            mapDoc.getActiveView().refresh();
        }
    }
    catch (Exception e){
        e.printStackTrace();
    }
}
Ruler settings
Rulers show the page size and elements on the printed map. The following illustration shows a horizontal ruler with the SmallestDivision property set to 2.

The following illustration shows the same ruler again, but with the SmallestDivision property set to 0.1 (there are now 10 markings between each inch).

The PageLayout object has a RulerSettings object that manages ruler settings. Although this object is cocreatable, there is no need to create one since the PageLayout object automatically instantiates one when it is created. Use IPageLayout.GetRulerSettings to get a reference to the RulerSettings object associated with the layout view. See the following illustration:

The IRulerSettings interface only has methods to set the SmallestDivision. This property controls the size of the smallest ruler division in page units. For example, if the page size is 8.5 by 11 inches and the SmallestDivision is set to 2, the rulers in layout view read off every 2 inches. If the property is set to .1, the rulers read off every 1/10 of an inch. See the following illustration:

See the following code example:
[Java]
public void changeRulerSettings(){
    try{
        IRulerSettings rulerSettings = mapDoc.getPageLayout().getRulerSettings();
        rulerSettings.setSmallestDivision(2);
        mapDoc.getActiveView().refresh();
    }
    catch (Exception e){
        e.printStackTrace();
    }
}
Graphic snap environment
The graphic snap environment controls active graphic snap agents, the order called, and the snap tolerance.
To aid in aligning and positioning elements on a page, the layout view supports element snapping. Elements can be snapped to the snap grid, rulers, guides, and margins. Snapping is performed by a combination of efforts between snapping target objects and snap agents. Snap agents attempt to move a graphic to a position on a snapping target object. The PageLayout object manages the snap agents, snapping target objects, and the snapping environment.
The GraphicSnapEnvironment object manages the graphic snap agents. This object is cocreatable, but this is not necessary since the PageLayout object automatically creates the object when it is created. The PageLayout aggregates a GraphicSnapEnvironment object making it part of the PageLayout object. See the following illustration:

To get a reference to the GraphicSnapEnvironment associated with the page layout, perform a query interface from any of the other interfaces on PageLayout, such as IPageLayout.
Use the IGraphicSnapEnvironment interface to add or delete snap agents and to snap a graphic into place with SnapShape. The SnapShape method calls each snap agent's snap method until a value of true is returned, which indicates the graphic has been moved. When a snap agent returns true, no other snap agents are called. You can also use the SnapAgentOrder property on this interface to control the call order of the snap agents. With this interface, you can establish a snap agent priority; for example, you could decide that snapping to the snap grid is more important than snapping to the page margins. See the following illustration:
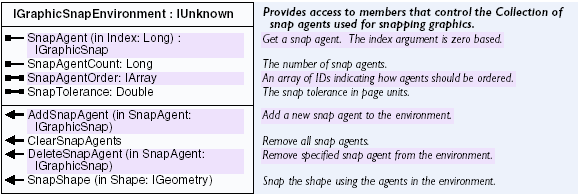
Graphic snap coclasses
The grid snap moves graphics to the snap grid. The guide snap moves graphics to the horizontal and vertical guides. The margin snap snaps graphics to the printable bounds of the layout. The ruler snap snaps graphics to the rulers. See the following illustration:
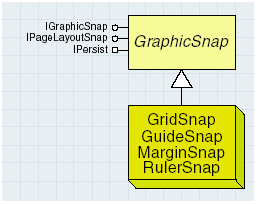
Rulers, guides, and grids are layout objects that help to align elements on a page and also have snap agents that snap to them. Layout snap agents include GridSnap, GuideSnap, MarginSnap, and RulerSnap. There is a one-to-one correlation between the snap agents and the objects to which they snap. For example, the GridSnap snap agent attempts to snap graphic elements to the snap grid created by the SnapGrid object. The exception is the MarginSnap snap agent, which snaps to the layout's printable bounds (IPage.getPrintableBounds).
Graphics are snapped into place by calling IGraphicSnapEnvironment.GetSnapShape on the PageLayout object. SnapShape in turn calls IGraphicSnap.GetSnapX and IGraphicSnap.GetSnapY on each active snap agent (in the order specified by IGraphicSnapEnvironment.GetSnapOrder) until one of the snap agents returns true, indicating that a new point has been found that meets the criteria of the snap agent. SnapX and SnapY are separate calls because some agents, such as guides, may only act in one direction.
GraphicSnap is an abstract class with the interface IGraphicSnap, which all graphic snap agents implement.
In ArcObjects, a guide snap agent is automatically created and snaps to vertical and horizontal snap guides. There is no need to create more than one type of snap agent. In ArcObjects, you can access the snapping environment and snap agents by right-clicking the layout view and clicking Options. On the Layout View tab, you can turn snap agents on or off, control the snap agent order, and set the snap tolerance. See the following illustration:

All graphic snap agents implement the IGraphicSnap interface. This interface has the following members: Name, SnapX, and SnapY. SnapX and SnapY are unique and are used to determine if a graphic can be snapped. For example, the GridSnap agent's implementation of SnapX for polygon graphics checks if the Xmin or Xmax of the graphics bounding rectangle is within snap tolerance of the snap grid. If either is, the graphic is moved the calculated distance between the two. SnapX and SnapY always return a Boolean, indicating whether or not the graphic was snapped. If any snap agent returns true, no other snap agents are called.
The IPageLayoutSnap interface is used to tie the snap agents to the PageLayout object. If this property is not set, the graphic snap agents will not work properly. Because IPageLayoutSnap inherits from IGraphicSnap, all the methods on IGraphicSnap are available on IPageLayoutSnap. See the following illustration:

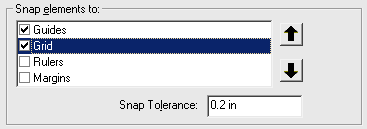
The following code example shows how a grid snap agent can be added to the layout. After you have run this code, right-click the layout and open the Options dialog box. On the Layout View tab, the Snap elements to Grid option will be checked. See the following screen shot:
public void addGridSnapAgent(){
    try{
        IPageLayout layout = mapDoc.getPageLayout();
        IGraphicSnapEnvironment snapping = (IGraphicSnapEnvironment)layout;
        GridSnap layoutSnap = new GridSnap();
        layoutSnap.setPageLayout(layout);
        snapping.addSnapAgent(layoutSnap);
    }
    catch (Exception e){
        e.printStackTrace();
    }
}
Map elements
Map elements are used in the map or page layout to display basic shapes, text labels, and so on. Map elements can also be used in the page layout to display marginalia and to display on or around the map information that is not directly conveyed by the geographic features. See the following illustration:
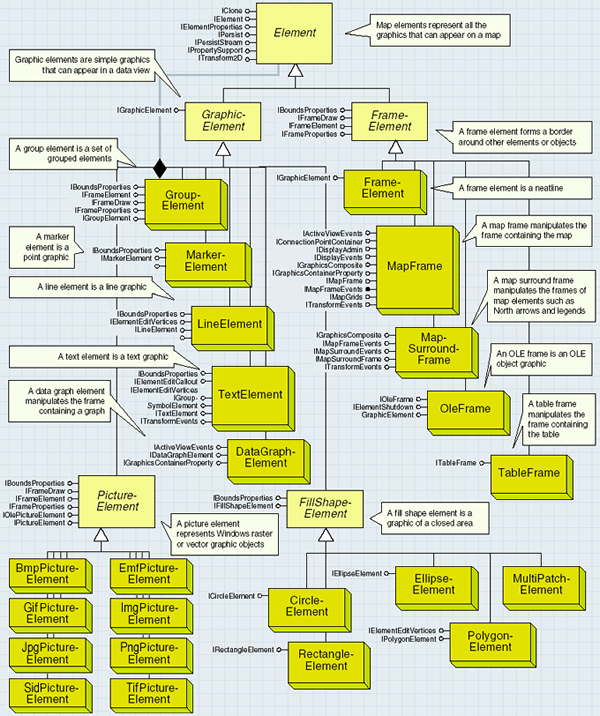
A map layout and a data frame can contain elements, but elements are most commonly manipulated as part of a map layout. Elements can basically be thought of as the nonfeature-based components of a map. Supported elements include FrameElements, which hold maps; MapSurroundFrames, which hold north arrows; scale bars; and GraphicElements, which hold text, line, point, fill shape, and picture elements. See the following illustration:
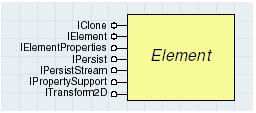
Element is the abstract class on which all graphic elements and frames are based.
Elements are commonly accessed through the IGraphicsContainer interface implemented by the Map and PageLayout objects. Through this interface, you can add, delete, update, and retrieve the individual elements in a map or page layout. Use the GroupElement object to combine multiple elements into a single unit for manipulation by the user. See the following illustration:
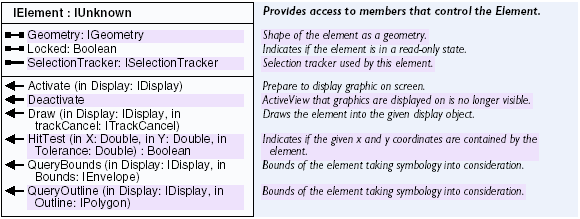
IElement is the generic interface implemented by all graphic elements and frames. Most methods that return graphics (various methods and properties of IGraphicsContainer and IGraphicsContainerSelect) return them as generic IElement objects. IElement gives the programmer access to the geometry of the object and employs methods for querying and drawing the object.
It is the programmer's responsibility to determine what type of object is hosting the IElement interface by performing a QI. In Visual Basic (VB), check the elements in a page layout for PolygonElements. See the following code example:
[Java]
public void countPolygonElements(){
    try{
        IPageLayout layout = mapDoc.getPageLayout();
        IGraphicsContainer container = (IGraphicsContainer)layout;
        container.reset();
        IElement element = container.next();
        int count = 0;
        while (element != null){
            if (element instanceof IPolygonElement){
                count++;
            }
            element = container.next();
        }
        System.out.println("TOTAL POLYGON ELEMENTS: " + count);
    }
    catch (Exception e){
        e.printStackTrace();
    }
}
The SelectionTracker property returns an ISelectionTracker, which can be used to reshape the element. Reshaping of elements is done via handles around the edges of the element. QueryBounds and QueryOutline require instantiated objects to be passed in. The results of each will be the same for line and point elements, but will vary for polygon elements (QueryBounds returns the bounding box, while QueryOutline returns an outline of the element).
IElementProperties is a generic interface implemented by all graphic elements and frames and allows the developer to attach custom properties to an element. The Name and Type properties allow the developer to categorize custom properties. Use the IElementProperties2 interface to access the reference scale of the element. See the following illustration:

AutoTransform is a Boolean value that indicates whether internal settings should be transformed along with the element's geometry when a transform is applied via ITransform2D. For example, if you have a point element and you rotate it around a central location (the anchor point of the rotation being different from the point element), then the AutoTransform property is used to determine whether the orientation of the symbol associated to the element should also be rotated by the same amount.
Graphic elements
Descending from the Element abstract class, GraphicElement objects are elements that work in a data frame and a map layout. This category of elements includes text, lines, points, polygons, and pictures. See the following illustration:
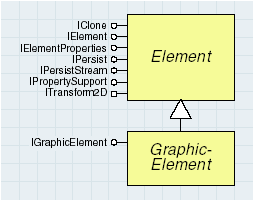
Graphic elements are added to a data frame or map to highlight areas or provide detail beyond that of the geographic features. The process of redlining (marking areas for correction or notification) can be done by adding graphic elements to the map. Annotation, which is used to label features, is unique because it is a geographic feature and a graphic element (specifically a TextElement). Annotation is added to the map based on attribute values or other text strings.
The IGraphicElement interface is a generic interface implemented by all graphic elements. This interface provides access to the spatial reference of the element. See the following illustration:

The ITransform2D interface is implemented by elements and basic geometries (points, polylines, and so on) to aid in the repositioning of objects. This interface allows elements and geometries to be moved, rotated, scaled, and transformed to new locations. It is implemented for graphic elements so that they can move along when the geometry of the features to which they are linked is modified. See the following illustration:

FillShape elements
The FillShapeElement abstract class is a type of element, but it is also an abstract class supporting CircleElement, EllipseElement, PolygonElement, and RectangleElement. Each of the supported elements represents a two-dimensional, closed area graphic. See the following illustration:
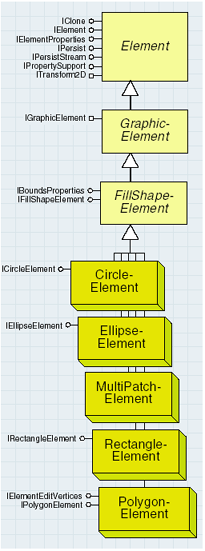
IFillShapeElement is a generic interface supported by all FillShapeElements. This interface provides access to the symbology used to display the element. See the following illustration:

IPropertySupport is the interface implemented by the elements and other components (DimensionLayer, FeatureLayer, TinEdgeRenderer, and so on) to provide access to generic properties of the object. The interface determines whether a certain property can be applied to an object and allows that property to be applied when appropriate.
- Applies indicates whether an object can be applied.
- CanApply indicates whether an object can be applied at that moment (whether or not the object is currently editable).
- Current returns the current object.
See the following illustraiton:

The are many types of graphic elements. The following table is a list and description of each graphic element type:
|
Graphic element
|
Description
|
| GroupElement | Displays a group of graphic elements |
| MarkerElement | Displays markers (point symbols) |
| LineElement | Displays lines |
| TextElement | Displays text |
| DataGraphElement | Displays a data graph |
| CircleElement | Displays circles |
| EllipseElement | Displays ellipses |
| PolygonElement | Displays polygons |
| RectangleElement | Displays rectangles |
| MultiPatchElement | Displays multipatch 3D elements, which uses a multipatch geometry in ArcScene and a series of 3D surfaces represented as groups of geometries |
| ParagraphTextElement | Displays text that flows into an area geometry |
| Text3DElement | Displays 3D text |
| BmpPictureElement | Displays .bmp images |
| EmfPictureElement | Displays .emf images |
| GifPictureElement | Displays .gif images |
| ImgPictureElement | Displays .img images |
| InkGraphic | Displays Tablet PC Ink graphic objects |
| JpgPictureElement | Displays .jpg images |
| PngPictureElement | Displays .png images |
| SidPictureElement | Displays .sid images |
| TifPictureElement | Displays .tif images |
Frame elements
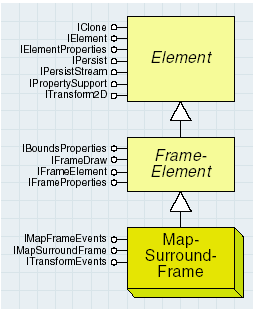
FrameElement is the abstract class on which all frame element objects are based. The FrameElement types include FrameElement (holds point, line, and polygon graphics), OleFrame (holds Object Linking and Embedding [OLE] objects, such as Word documents), MapFrame (holds maps), and MapSurroundFrame (holds north arrows, scale bars, legends, and other map primitives). See the following illustration:
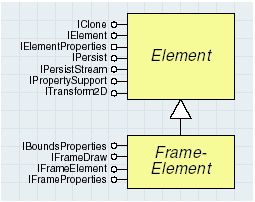
FrameElements contain other map elements that serve as the background and border to these elements. The MapFrame element holds a map and allows the programmer access to that map along with the background and border properties of the container holding that map in the layout.
The IFrameElement interface is a generic interface for manipulating the properties of the frame (not the object in the frame). This interface provides access to the background and border properties of the frame, as well as access to the object in the frame.
The Object property returns the object in the frame as a variant. The programmer is required to determine the type of object it is. To get an IMap object, determine if the FrameElement supports IMapFrame and use the Map property of that interface.
Frame decorations are used to determine how frame elements are displayed. You might use a frame decoration to alter the background of an active view, add a shadow to a group of graphic elements, or draw a neatline around a map. For more information, see the IFrameDecoration interface documentation.
Map frames
MapFrame objects are unique among the other frames and elements because they support events (MapSurroundFrames also support events) and reference grids. The MapFrameResized event is supported through IMapFrameEvents to allow for the updating of map grids (graticules) when the frame is resized. Map grids are only supported through the MapFrame, not on the map. See the following illustration:
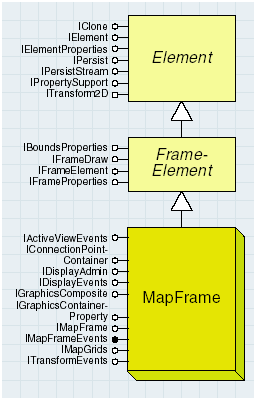
Check an element for the implementation of IMapFrame to determine if it is a MapFrame object. See the following illustration:
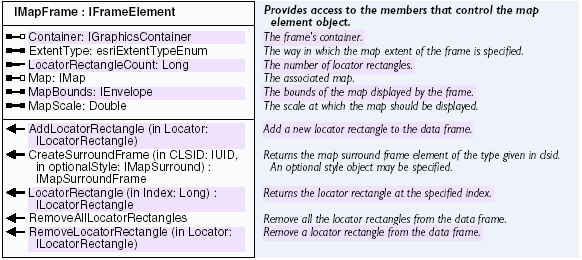
IMapFrame is the interface implemented only by the MapFrame coclass. The interface provides access to the map in the frame and has the ability to create locator rectangles (locator rectangles can be used to highlight inset areas) outlining the areas covered by other data frames.
Map surrounds
Map surrounds are specific types of elements that are associated with a Map object. A good example of a map surround and its capabilities is the north arrow. North arrows are built as map surrounds so that they can respond to map rotation. When a map is rotated, its north arrow is rotated the same amount. See the following illustration:
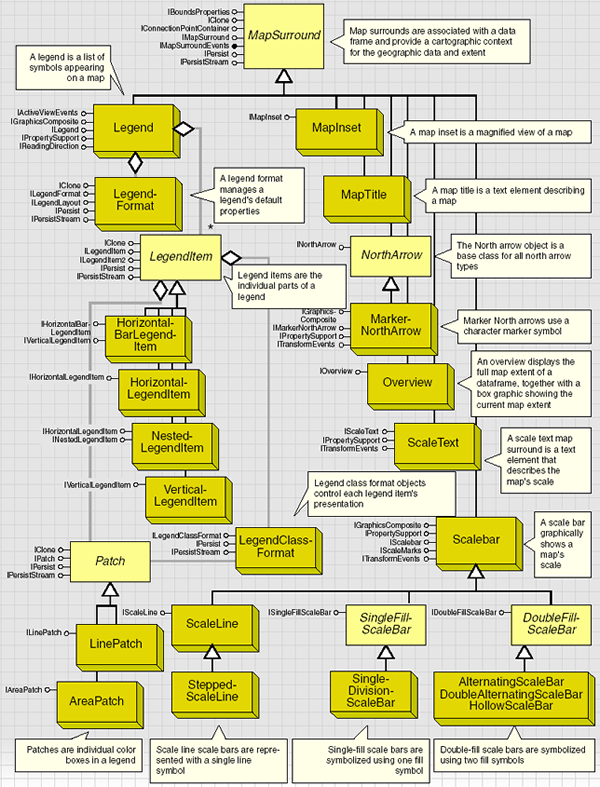
In ArcObjects, map surrounds are always contained by a MapSurroundFrame object—a type of element. MapSurroundFrames are similar to MapFrames, which house a Map object, where the PageLayout object manages both (the PageLayout manages all frame objects). Each MapSurroundFrame is also related to a MapFrame. If a MapFrame is deleted, all of its MapSurroundFrames are deleted. Map surrounds are placed on the layout, not in a map's graphic layer. See the following illustration:
Map surrounds can be moved anywhere on the layout, not just within the confines of a map frame. Because map surrounds are directly associated with a map, the map has a shortcut to all the associated map surrounds (IMap.GetMapSurrounds). This member, along with IMap.GetMapSurroundCount, allows you to loop through all of the available map surrounds for a given Map object.
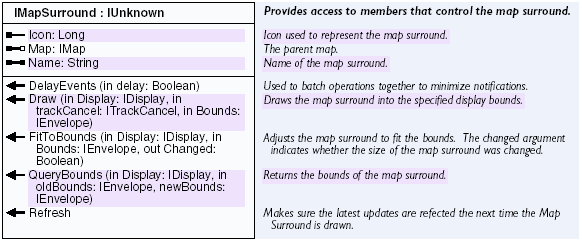
All map surrounds implement the IMapSurround interface. This interface provides all the common functionality between all map surrounds. Use this interface to access the name of a particular map surround and the associated map. This interface also has methods for determining a surround's size and changing it. See the following illustration:
IMapSurroundsEvents is the outbound interface for all map surround objects. This interface allows you to draw a map surround in a window. The events let the window know when to redraw. See the following illustration:

Legend coclass
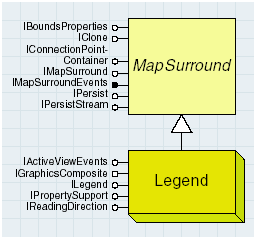
The Legend coclass is a complex MapSurround object because it relies on several other objects to create a legend. See the following illustration:
The different elements comprised in a legend are provided by the renderers used to display the different map layers. Each renderer corresponds to a LegendItem in the legend. Each LegendItem contributes one or more LegendGroup objects to the legend. The number of legend groups depends on the renderer's implementation; for example, the Multiple Attributes renderer can provide up to three legend groups. See the following illustration:
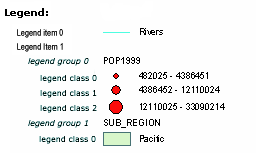 Each LegendGroup, in turn, contains one or more LegendClass objects. A LegendClass object represents an individual classification and has its own symbol and label—a description and format are optional. The preceding illustration identifies these elements in a legend.
The Legend class primary interface is ILegend. Use this interface to modify a legend and access its components. For example, ILegend provides access to legend items and its legend format object. ILegend also manages a few of the legend properties, such as the title. When changing the properties of an existing legend, call ILegend.Refresh to have the changes reflected in the layout. See the following illustration:
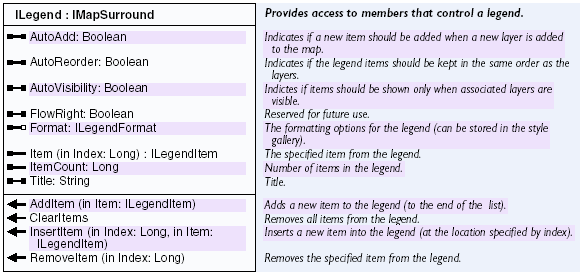
Formatting the legend
The aspect of the legend can be further modified using the ILegendFormat interface on the LegendFormat object returned by ILegend.GetFormat. You can also use the IReadingDirection interface to set the legend item's alignment left or right. To control the appearance of the legend, you can use additional interfaces to access the individual components of the legend: LegendItems and the patches. Patches are the individual color boxes or lines associated with each legend class. See the following illustration:
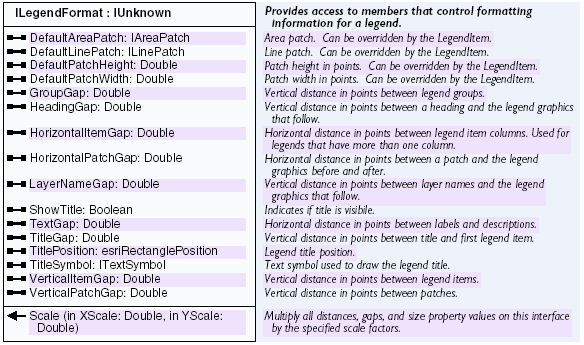
ILegendClassFormat is an interface similar to ILegendFormat but at the LegendItem level. If the LegendClassFormat is not set by the renderer creating the legend, the properties used to draw the LegendItem's content will be the default defined in the LegendFormat object. See the following illustration:

Legend items
The construction of the legend is the work of map layers through the associated LegendItem objects. The legend can be seen as a collection of layers, with each layer being represented by a LegendItem. When the legend is refreshed, the LegendItem creates a set of graphic elements to display, pulling the information from its associated layer and the format from the objects described in the previous section. The legend positions the title and legend item graphics relative to one another. See the following illustration:
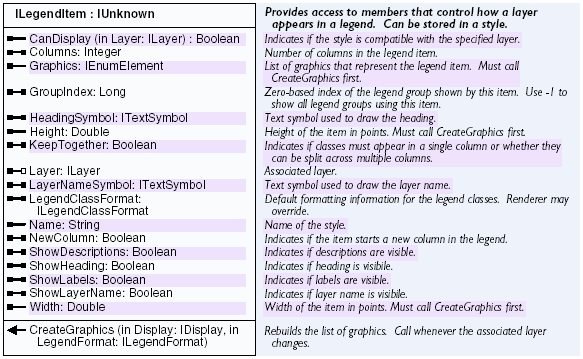
All legend items implement the ILegendItem interface. The interface controls all of the properties a legend item has—the associated layer; number of columns it spans; whether it should be displayed in a new column; and whether the label, description, heading, and layer name should be displayed. This interface also provides access to the legend items LegendClassFormat object. See the following illustration:

Horizontal and vertical legend items use the esriLegendItemArrangement enumeration, which can be set with IHorizontalLegendItem.SetArrangement and IVerticalLegendItem.SetArrangement to specify the position of the label, patch, and description.
The default is esriPatchLabelDescription, which translates to the patch, label, and the description (if available). The following table shows the components of the legend in this order with a custom area patch:
Patch | Label | Description |
 | California | Golden state |
 | Oregon | Beaver state |
 | Washington | Evergreen state |
The following table shows the types of legend items:
Area and patches | Legend item type |
 | Horizontal legend items—(HorizontalLegendItem) are the default and most commonly used class of legend items. |
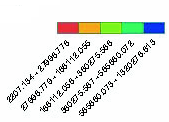 | Horizontal bar legend items—(HorizontalBarLegendItem) the IHorizontalBarLegendItem interface supports additional properties for controlling the angle of the labels above and below the patch. The default is to display the labels at a 45 degree angle. |
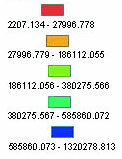 | Vertical legend items—(VerticalLegendItem) have patches on top of the legend item text. |
 | Nested legend items—(NestedLegendItem) work with graduated symbols. The patch to the left shows a legend with a default nested legend item. The INestedLegendItem interface controls the properties a nested legend item has, including whether or not to label the ends, the leader symbol, and the outline symbol. |
North arrows
MarkerNorthArrows are character marker symbols originating from the ESRI north font. However, any character from any font can be used as a north arrow. See the following illustration:
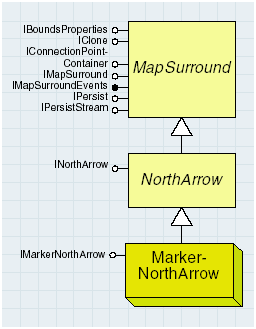
MarkerNorthArrows implement two additional interfaces: INorthArrow and IMarkerNorthArrow. The INorthArrow interface provides a common interface for north arrow properties, such as size, color, and reference location. See the following illustration:

IMarkerNorthArrow has one property, MarkerSymbol, that controls the marker symbol used by the north arrow. By default, the marker symbol belongs to the ESRI north font. See the following illustration:

Map insets
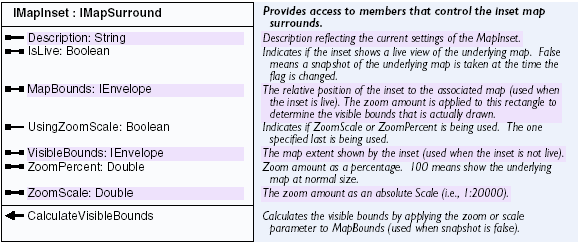
A MapInset is a miniture map that shows a magnified view of a map. See the following illustration:
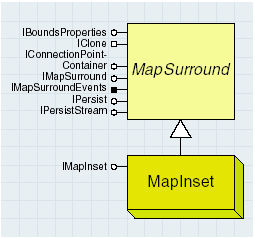
A MapInset map surround is another view of the current map extent. If you pan or zoom in the map the MapInset is related to, the MapInset mimics the change. See the following illustration:
Map title and overviews
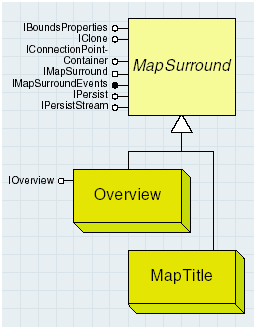
An overview map surround is the surround found in overview data windows. The MapTitle object is a map surround that holds a piece of text you can use to label a map. This may not be the title of the complete layout, but a subtitle for a specific map in the layout. See the following illustration:
Scale bars
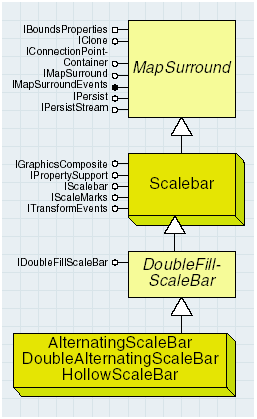
There are many types of scale bar map surrounds, including several types of scale lines, single-fill scale bars, and double-fill scale bars. All scale bars implement IScaleBar and IScaleMarks. See the following illustration:
The IScaleBar interface manages most of a scale bar's properties, including bar color, bar height, division, and label frequency. See the following illustration:
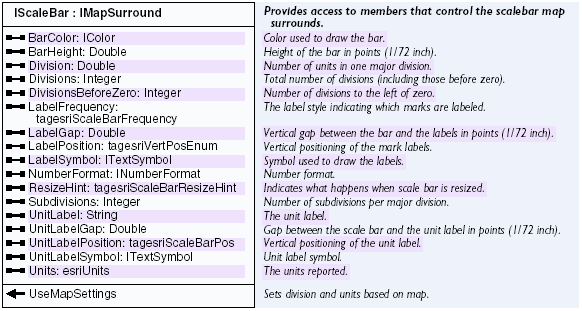
The IScaleMarks interface manages all of the properties of a scale bar that relate to the individual marks, including the division and subdivision mark's heights and symbols, frequency, and position. See the following illustration:

Double-fill scale bars are the most advanced scale bars and use two symbols to create an attractive scale bar. The following illustration shows the types of double-fill scale bars: alternating, double-alternating, and hollow:
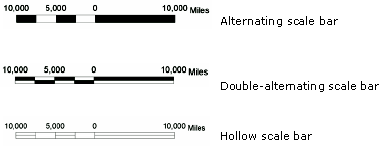
All double-fill scale bars implement the IDoubleFillScaleBar interface, which manages the two fill symbols used when rendering the scale bar. See the following illustration:

Single-fill scale bars are similar to double-fill scale bars except one fill symbol is used—ArcObjects has the SingleDivisionScaleBar. See the following illustration:

The ISingleFillScaleBar interface manages the single-fill symbol used by scale bars of this type. See the following illustration:

Scale line scale bars are the only class of scale bars that represent a scale bar as a line—ArcObjects has the SteppedScaleLine scale bar. See the following illustration:
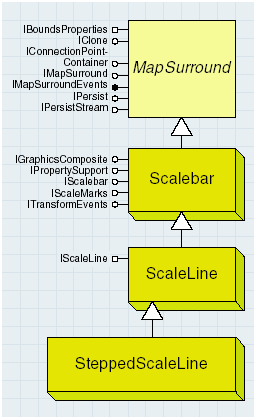
Scale lines are another class of scale bars based on line work instead of polygons. The following illustration shows the stepped-line scale bar:

The IScaleLine interface manages the one line symbol used by scale lines. See the following illustration:

ScaleText is essentially a text element that describes the map's scale. One example of scale text is one inch equals 2,400 miles. See the following illustration:
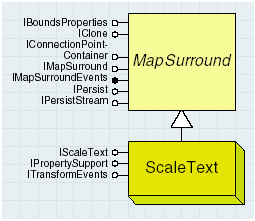

The IScaleText interface controls the format of the string that is added as a map surround element. This interface has properties, such as MapUnits, MapUnitLabel, PageUnits, PageUnitLabel, and Text, which combines the label properties into a sentence. See the following illustration:

Map grids
The Carto library contains a set of map grid objects to display index and geographic reference grids on a map. See the following illustration:
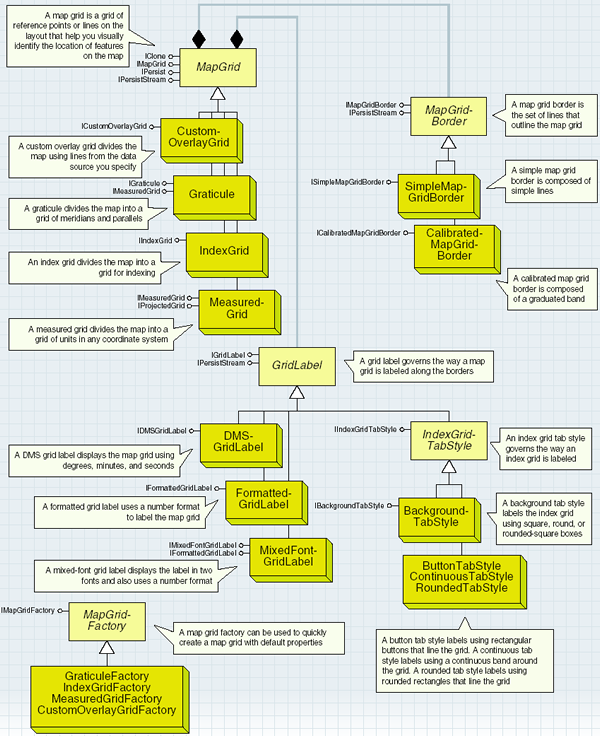
A map grid can be a grid of geographic or projected coordinates, or a reference grid like those found in street maps. Map grids are part of the layout of a map and can only be seen in layout view. The following illustration shows the parts of a map grid:
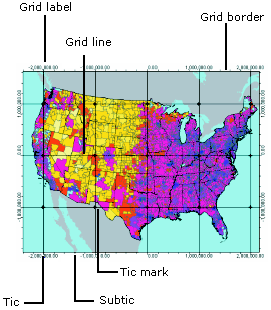
To get to a map grid programmatically, navigate to the PageLayout coclass and use the IGraphicsContainer interface's FindFrame method to get to the map's MapFrame. The MapFrame coclass has an IMapGrids interface from which you can get to all the map grids for that data frame. See the following code example:
[Java]
public void findMapGrid(){
    try{
        IPageLayout layout = mapDoc.getPageLayout();
        IMap map = mapDoc.getActiveView().getFocusMap();
        IGraphicsContainer container = (IGraphicsContainer)layout;
        IMapFrame frame = (IMapFrame)container.findFrame(map);
        IMapGrids grids = (IMapGrids)frame;
        IMapGrid mapGrid = null;
        if (grids.getMapGridCount() > 0)
            mapGrid = grids.getMapGrid(0);
        else
            System.out.println("NO GRID FOUND!");
    }
    catch (Exception e){
        e.printStackTrace();
    }
}
IMapGrid provides access to the methods and properties common to all types of map grids. The Draw method can be used to draw a map grid to, for example, a PictureBox control that has a map and display associated with it. The PrepareForOutput method takes the device's handle device context (HDC), which is called before the Draw method. See the following illustration:
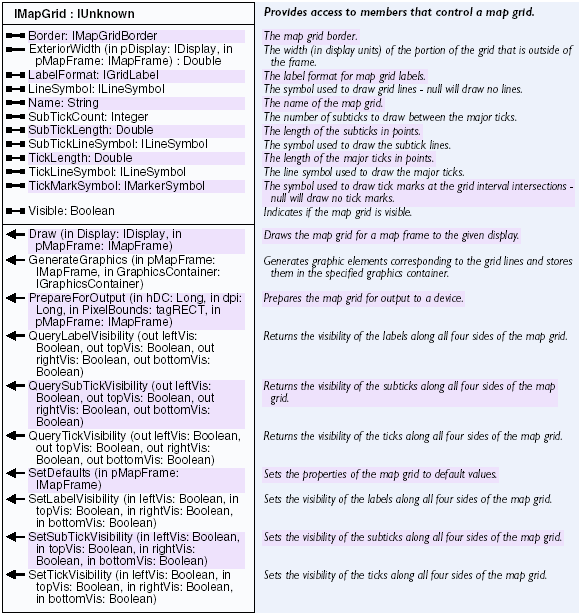
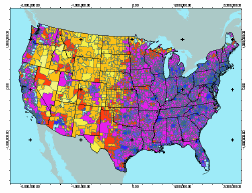
If you want tick marks in your grid, create a marker symbol and assign it to the IMapGrid.TickMarkSymbol property. If you do not want a TickMarkSymbol or a TickLineSymbol, set these properties to nothing. See the following illustration:
When you create a new map grid, populate the properties of the grid that IMapGrid exposes. After doing this, populate the properties exposed by interfaces specific to the grid type and add the grid to a data frame. The following example shows how to create a custom grid. Modify its properties and labels and add it the map frame. It is best to use cartographic line symbols so that the grids lines have square butts.
[Java]
public void createGrid(){
    try{
        Graticule mapGrid = new Graticule();
        mapGrid.setName("Map Grid");

        //Create a color.
        RgbColor color = new RgbColor();
        color.setRed(255); //Set the color to red.

        //Set the symbol for drawing the grid.
        CartographicLineSymbol lineSymbol = new CartographicLineSymbol();
        lineSymbol.setCap(esriLineCapStyle.esriLCSButt);
        lineSymbol.setColor(color);
        mapGrid.setLineSymbol(lineSymbol);

        //Clear the default frame border.
        mapGrid.setBorder(null);

        //Set the tic properties.
        mapGrid.setSubTickCount((short)5);
        mapGrid.setSubTickLength(10);
        CartographicLineSymbol tickLine = new CartographicLineSymbol();
        tickLine.setCap(esriLineCapStyle.esriLCSButt);
        tickLine.setWidth(0.2);
        tickLine.setColor(color);
        mapGrid.setSubTickLineSymbol(tickLine);

        //Set the grid label properties.
        IGridLabel label = mapGrid.getLabelFormat();
        label.setLabelOffset(15);

        //Set the tick, subtick, label visibility and the four sides of the grid.
        mapGrid.setTickVisibility(true, true, true, true);
        mapGrid.setSubTickVisibility(true, true, true, true);
        mapGrid.setLabelVisibility(true, true, true, true);

        //Make the map grid visible so it gets drawn when the active vew updates.
        mapGrid.setVisible(true);

        //Set the grid's measure properties.
        mapGrid.setFixedOrigin(true);
        mapGrid.setXIntervalSize(10); //Meridian interval.
        mapGrid.setXOrigin(5); //Shift the grid five inches.
        mapGrid.setYIntervalSize(10); //Parallel interval.
        mapGrid.setYOrigin(5);

        //Add the grid to the map frame.
        IPageLayout layout = mapDoc.getPageLayout();
        IMap map = mapDoc.getActiveView().getFocusMap();
        IGraphicsContainer container = (IGraphicsContainer)layout;
        IMapFrame frame = (IMapFrame)container.findFrame(map);
        IMapGrids grids = (IMapGrids)frame;
        grids.addMapGrid(mapGrid);

        //Refresh the view.
        IActiveView activeView = mapDoc.getActiveView();
        activeView.partialRefresh(esriViewDrawPhase.esriViewBackground, null, null);
    }
    catch (Exception e){
        e.printStackTrace();
    }
}
The IMeasuredGrid interface is implemented by the MeasuredGrid and Graticule coclasses and exposes information on the origins, intervals, and units of the grid. See the following illustration:

If you set IMeasuredGrid.SetFixedOrigin to false, the origin is computed from the data frame instead of from the x,y origin properties. IMeasuredGrid.SetUnits does not have to be set for a graticule.
The following illustration shows a graticule dividing the map by meridians and parallels:
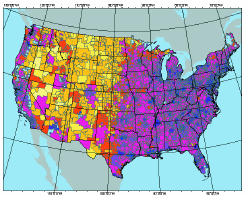
Index grids
An index grid is a map grid that divides the map into the specified number of columns and rows. It is mainly used to index a map.
IIndexGrid gives you access to the functionality common to all index grids. See the following illustration:

Using the XLabel and the YLabel properties, set or retrieve the label for each column and index in the grid. You can create an index grid as shown in the following code example:
[Java]
public void createIndexGrid(){
    try{
        IndexGrid indexGrid = new IndexGrid();
        //Set the properties.
        indexGrid.setColumnCount(5);
        indexGrid.setRowCount(5);
        //Set the grid label strings for the x,y axes.
        for (int i = 0; i < indexGrid.getColumnCount(); i++)
            indexGrid.setXLabel(i, i + "A");
        for (int i = 0; i < indexGrid.getRowCount(); i++)
            indexGrid.setYLabel(i, i + "A");
    }
    catch (Exception e){
        e.printStackTrace();
    }
}
IIndexGrid.QueryCellExtent is useful to find features that cross a cell in the grid. Use the envelope returned by this method in a spatial filter after transforming it into map coordinates using IDisplayTransformation.TransformRect. Use this filter to search the features that cross the cell in the grid and to create an index listing of features and location on the grid. See the following illustration:
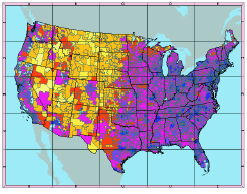
Measured grid
A measured grid is a map grid with grid lines on a coordinate system specified using the IProjectedGrid interface. See the following illustration:

The IProjectedGrid interface holds the spatial reference information associated with a measured grid. If you want to create a measured grid in the same projection as the data frame it is in, set the SpatialReference property using the data frame's IMap.SetSpatialReference property.
A measured grid divides the map into a grid of units in a coordinate system of your choice. The grid can be in a projected coordinate system or in a geographic coordinate system. A measured grid in a geographic coordinate system is equivalent to a graticule.
A measured grid can be in the same spatial reference system as the data frame or in a different one. To create a measured grid with a different projection, create an instance of a coclass that inherits from SpatialReference. You can then set the IProjectedGrid.SetSpatialReference method of the grid with the ISpatialReference interface of this object.
The following code example shows how to create a measured grid and set the properties exposed through its specific interfaces:
[Java]
public void createMeasureGrid(){
    try{
        MeasuredGrid measureGrid = new MeasuredGrid();
        //Set the properties.
        measureGrid.setFixedOrigin(true);
        IMap map = mapDoc.getActiveView().getFocusMap();
        measureGrid.setUnits(map.getMapUnits());
        measureGrid.setXIntervalSize(1000000);
        measureGrid.setXOrigin( - 3000000);
        measureGrid.setYIntervalSize(1000000); //Parallel interval.
        measureGrid.setYOrigin( - 3000000);
        //Set the projected grid properties.
        measureGrid.setSpatialReferenceByRef(map.getSpatialReference());
    }
    catch (Exception e){
        e.printStackTrace();
    }
}
Custom overlay grids
A custom overlay grid is a map grid with grid lines read from a feature. The ICustomOverlayGrid interface gives you access to the feature class that the grid lines are read from through the ICustomOverlayGrid.GetDataSource method. It also lets you specify which field in this feature class labels the grid using the ICustomOverlayGrid.GetLabelField method. See the following illustration:

Map grid borders
The map grid border coclasses determine how the outline of a map grid is drawn. Using the IMapGridBorder interface, you can find the width of the map grid border. Using the DisplayName property, you can report the type of border object to which the IMapGridBorder interface is pointing.
The following illustration shows the strings reported by this property for the two border types:

When you create a new map grid border, you don't have to use the IMapGridBorder interface. All the properties exposed by this interface are read-only. A simple map grid border is drawn using a line symbol specified with the ISimpleMapGridBorder interface. See the following illustration:

The ISimpleMapGridBorder interface provides access to the line symbol used to draw the grid border through the LineSymbol property. See the following illustration:

The following illustration shows a simple map grid border:
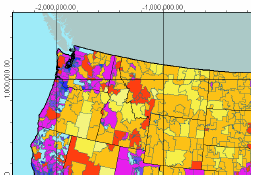
The following code example shows how you can create a simple map grid border:
[Java]
SimpleMapGridBorder mapGridBorder = new SimpleMapGridBorder();
//Set the properties.
SimpleLineSymbol lineSymbol = new SimpleLineSymbol();
lineSymbol.setStyle(esriSimpleLineStyle.esriSLSSolid);
RgbColor color = new RgbColor();
color.setRed(255);
lineSymbol.setColor(color);
lineSymbol.setWidth(2);
mapGridBorder.setLineSymbol(lineSymbol);
//Add border to the map grid.
Calibrated map grid borders
The CalibratedMapGridBorder coclass encapsulates the functionality required to draw a map grid outline composed of a graduated band. See the following illustration:

You can use the ICalibratedMapGridBorder interface to set or retrieve the properties of a calibrated map grid border, such as the foreground and background color of the pattern, interval of the pattern, background color of the band, and width of the border.
If you want the pattern to alternate in two bands across the width of the border, set the Alternating property to true. Setting this property to false produces a border with a single band of the pattern. See the following illustration:
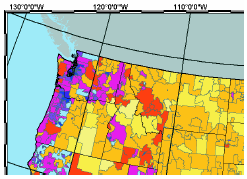
The interval of the pattern on the band is in points and page units. If you want to compute your border intervals in map units, you can use a DisplayTransformation to convert your interval from map units to page units. You can convert these to points, considering that there are 72 points in an inch. See the following code example:
[Java]
CalibratedMapGridBorder mapGridBorder = new CalibratedMapGridBorder();
//Set the properties.
RgbColor color1 = new RgbColor();
color1.setRed(255);
RgbColor color2 = new RgbColor();
color2.setBlue(255);
mapGridBorder.setBorderWidth(10);
mapGridBorder.setBackgroundColor(color1);
mapGridBorder.setForegroundColor(color2);
mapGridBorder.setInterval(72);
mapGridBorder.setAlternating(true);
//Add border to the map grid.
Grid labels
A grid label object is associated with every map grid object and provides the required functionality to draw labels around the map grid.
The IGridLabel interface holds properties common to all types of grid labels. Not all grid labels can be used with all grid types. The Applies property of IGridLabel returns true if the grid label can be used with the grid that you pass in as an argument. See the following illustration:
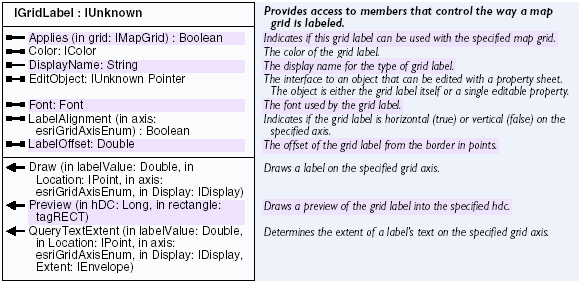
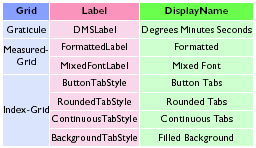
Using the IGridLabel.GetDisplayName property, you can list the type of label that the IGridLabel interface is pointing to. The following illustration shows the types of labels that can be used with each grid type and the strings returned for the various label types:
You can control the vertical or horizontal orientation of the labels along each of the four sides of the grid using the IGridLabel.SetLabelAlignment method. You specify the axis you are setting the property for using an esriGridAxisEnum enumeration. See the following illustration:

The following code example shows how to populate the properties exposed by IGridLabel for a new GridLabel:
[Java]
DMSGridLabel gridLabel = new DMSGridLabel();
//Set the font and color.
RgbColor color1 = new RgbColor();
color1.setRed(255);
StdFont font = new StdFont();
font.setName("Arial");
gridLabel.setColor(color1);
gridLabel.setFont(font);
//Specify the vertical labels.
gridLabel.setLabelAlignment(esriGridAxisEnum.esriGridAxisLeft, false);
gridLabel.setLabelAlignment(esriGridAxisEnum.esriGridAxisRight, false);
gridLabel.setLabelOffset(6);
Set the properties specific to the type of grid label and associate the new grid label to the grid using the grid's IMapGrid.SetLabelFormat method. IGridLabel.QueryTextExtent is used to check for labeling conflicts by ArcObjects. The IGridLabel.Get/SetEditObject method is used in the MapGrid property pages.
See the following code example:
[Java]
mapGrid.setLabelFormat(gridLabel);
DMS grid labels
A degrees, minutes, and seconds (DMS) grid label identifies the map grid using degrees, minutes, and seconds. You can use the DMSGridLabel coclass to label graticules.
IDMSGridLabel provides access to the font, color, and format information required to create a DMS grid label. See the following illustration:

The following illustration shows the types of grid labels that can be used and the object returned:

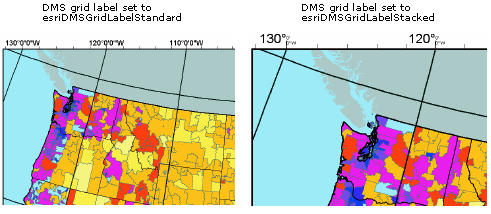
You can use a standard label to create a DMS label with the degrees, minutes, and seconds on the same line. A stacked label has the minutes stacked over the seconds, with both in smaller font size.
The LabelType property can be set using the esriDMSGridLabelType enumeration, which is shown in the following illustration. Only the esriDMSGridLabelStandard and esriDMSGridLabelStacked values are currently implemented.

The following illustration shows DMS grid labels set to esriDMSGridLabelStandard and esriDMSGridLabelStacked:
The following code example shows how to create a DMS grid label:
[Java]
DMSGridLabel dmsLabel = new DMSGridLabel();
//Set the font and color properties.
dmsLabel.setLabelType(esriDMSGridLabelType.esriDMSGridLabelStandard);
dmsLabel.setShowZeroMinutes(true);
dmsLabel.setShowZeroSeconds(true);
LatLonFormat format = new LatLonFormat();
format.setShowDirections(true);
dmsLabel.setLatLonFormat(format);
RgbColor color1 = new RgbColor();
color1.setRed(255);
StdFont font = new StdFont();
font.setName("Arial");
font.setBold(false);
font.setUnderline(false);
font.setSize(8);
dmsLabel.setMinutesFont(font);
dmsLabel.setMinutesColor(color1);
dmsLabel.setSecondsFont(font);
dmsLabel.setSecondsColor(color1);
Formatted grid labels
The FormattedGridLabel coclass uses any of the coclasses that inherits from the NumberFormat abstract class to create the grid labels. The IFormattedGridLabel interface has a Format property that takes an INumberFormat interface. See the following illustration:

The following illustration shows a measured grid with formatted grid labels:
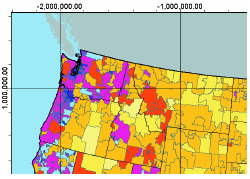
The following code example shows the creation of a formatted grid label:
[Java]
FormattedGridLabel gridLabel = new FormattedGridLabel();
//Set the properties.
NumericFormat numberFormat = new NumericFormat();
numberFormat.setAlignmentOption(esriNumericAlignmentEnum.esriAlignRight);
numberFormat.setRoundingOption(esriRoundingOptionEnum.esriRoundNumberOfDecimals);
numberFormat.setRoundingValue(2);
numberFormat.setShowPlusSign(false);
numberFormat.setUseSeparator(true);
numberFormat.setZeroPad(true);
gridLabel.setFormat(numberFormat);
Mixed font grid labels
A mixed font grid label uses two fonts to display the label. It also uses a number format to format the label string. Use the MixedFontGridLabel coclass to label map grids in two fonts and in the format specified using the IFormattedGridLabel interface.
The IMixedFontGridLabel.GetNumberOfDigits property determines how the two fonts are applied to the label string. The last n digits of the label—where n is the number assigned as the NumberOfDigits—are displayed in the secondary font and color. The remaining digits are displayed in the primary font and color. The primary font and color are set using IGridLabel.SetFont and IGridLabelColor.SetColor. The secondary font and color are set using IMixedFontGridLabel.SetSecondaryFont and IMixedFontGridLabel.SetSecondaryColor. See the following illustration:

The following illustration shows a measured grid with mixed font grid labels:
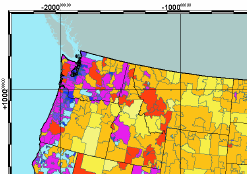
The following code example shows how you can create a mixed font grid label:
[Java]
MixedFontGridLabel fontGridLabel = new MixedFontGridLabel();
//Set the FontGridLabel properties.
StdFont font = new StdFont();
font.setName("Arial");
font.setSize(12);
fontGridLabel.setSecondaryFont(font);
RgbColor color = new RgbColor();
color.setRed(255);
fontGridLabel.setSecondaryColor(color);
fontGridLabel.setNumGroupedDigits((short)6); //–1 if not being used.
NumericFormat numericFormat = new NumericFormat();
numericFormat.setAlignmentOption(esriNumericAlignmentEnum.esriAlignRight);
numericFormat.setRoundingOption(esriRoundingOptionEnum.esriRoundNumberOfDecimals);
numericFormat.setRoundingValue(2);
numericFormat.setShowPlusSign(true);
numericFormat.setUseSeparator(false);
numericFormat.setZeroPad(true);
//Apply the format to the label.
fontGridLabel.setFormat(numericFormat);
Index grid tab styles
The IndexGridTabStyle coclasses provide the means to label an index grid. See the following illustration:
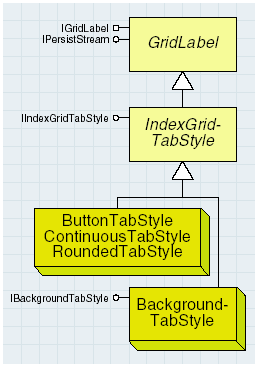
The IIndexGridTabStyle interface provides access to the color and thickness of the index grid's labels. Call the PrepareDraw method before IGridLabel.Draw is called on the index grid tab style labels. See the following illustration:

You can create an index grid tab style label using a coclass that inherits from IndexGridTabStyle. The following code example shows how to populate the properties exposed by the IIndexGridTabStyle interface after you create the label:
[Java]
RgbColor foreColor = new RgbColor();
foreColor.setRed(255); //Set the color red.
RgbColor backCcolor = new RgbColor();
backCcolor.setBlue(255); //Set the color blue.
//Set the properties.
RoundedTabStyle tabStyle = new RoundedTabStyle();
tabStyle.setForegroundColor(foreColor);
tabStyle.setOutlineColor(backCcolor);
tabStyle.setThickness(20);
Button tab style labels are rectangular buttons, each the width of the grid cell that it borders. The following code example shows how to create a button tab style grid label:
[Java]
ButtonTabStyle buttonStyle = new ButtonTabStyle();
Continuous tab style labels form a continuous band around the map grid. The following code example shows how to create this type of label:
[Java]
ContinuousTabStyle contTabStyle = new ContinuousTabStyle();
Rounded tab style labels are rounded rectangles; each one is the width of the grid cell it borders. The following code example creates a rounded tab style grid label:
[Java]
RoundedTabStyle tabStyle = new RoundedTabStyle();
A background tab style labels the index grid using square, round, or rounded-square boxes. These boxes are centered outside the grid cells they border. See the following illustration:

IBackgroundTabStyle has a BackgroundType property you can use to determine the shape of the boxes that the BackGroundTabStyle label uses with the esriBackgroundTabType enumeration. See the following illustration:

The following illustration shows the esriBackgroundTabType enumeration:

The following code example shows how you can create a background tab style label that uses round boxes to label a map grid:
[Java]
BackgroundTabStyle backTabStyle = new BackgroundTabStyle();
//Set the properties.
backTabStyle.setBackgroundType(esriBackgroundTabType.esriBackgroundTabRound);
The following illustration shows esriBackgroundTabRound, esriBackgroundTabRectangle, and esriBackgroundTabRoundedRectangle:

Renderers
The ArcGIS renderer coclasses and interfaces are mainly in the Carto library. Renderers are objects that store symbolization for ArcGIS data layers and draws the data based on the stored symbolization rules. Layer coclasses and interfaces are also mainly in the Carto library. The renderer objects are divided into three main groups: Feature renderers; objects that render feature data, raster renderers; objects that render raster data, and TIN renderers; objects that render 3D TIN data.
Renderers are assigned to layers using different interfaces depending on whether you are working with feature, raster, or TIN data. After changing a layer's renderer properties or assigning a new renderer to a layer, update the display and table of contents to reflect these changes. See the following code example:
[Java]
mapDoc.getActiveView().partialRefresh(esriDrawPhase.esriDPGeography, layer, null);
Most renderers store symbol objects and use these to draw layers. Symbol coclasses and interfaces are mainly in the Display library. To assign or retrieve a renderer's symbols, use the specific interface for your particular renderer—for example, if you are working with a ClassBreaksRenderer, use IClassBreaksRenderer.SetSymbol; for a RasterUniqueValueRenderer, use IRasterUniqueValueRenderer.SetSymbol; for a TinElevationRenderer, use ITinColorRampRenderer.SetSymbol.
Feature renderers
The following illustration shows feature renderer objects:
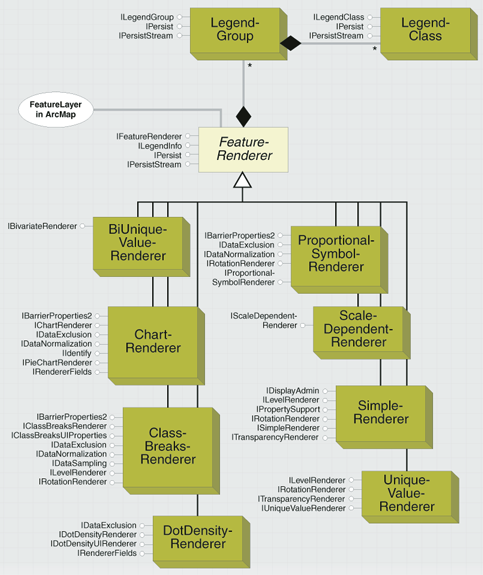
Feature renderers are used to symbolize feature layers. The following table shows the available feature renderer coclasses:
|
Feature renderer
|
Use
|
Map example
|
| SimpleRenderer | Each feature in the layer is symbolized with the same symbol. |

|
| UniqueValueRenderer | Features are drawn with different symbols depending on the unique values of one or more attribute fields. |
|
| ClassBreaksRenderer | Features are drawn with graduated color (choropleth) or graduated size symbolization based on values in an attribute field. The data value range is divided into classes with each feature having membership in only one of these classes based on its attribute value. Features are drawn with the symbol corresponding to their class. |

|
| ProportionalSymbolRenderer | Features are drawn with proportionally sized symbols based on values in an attribute field. |

|
| DotDensityRenderer | Polygon features are drawn with randomly placed dots where the dot count for each feature represents the value of an attribute field. |

|
| ChartRenderer | Features are drawn with pie, bar, and stacked bar charts. Chart content is based on values stored in one or more attribute fields. |
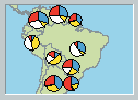
|
| BiUniqueValueRenderer | Features are drawn with a symbolization that is a combination of a UniqueValueRenderer and a ClassBreaksRenderer. Values from separate orthogonal attribute fields generate a single symbolization based on these two components. |
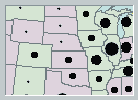
|
| ScaleDependentRenderer | A renderer composed of multiple renderers, with each operating in a particular scale range. |
|
Accessing feature renderers
Each feature layer is assigned one feature renderer. To get a feature renderer object from a layer, use IGeoFeatureLayer.GetRenderer. To set a renderer to a layer, use the same property.
FeatureRenderer abstract class
All feature renderer coclasses inherit from the abstract class, FeatureRenderer. Developers can implement their own feature renderer by implementing all of the interfaces implemented by this class.
FeatureRenderer implements IFeatureRenderer, which provides access to properties and methods common to all feature renderers. This base class also implements persistence interfaces that allow feature renderers to be saved and loaded from disk as part of .lyr and .mxd files.
All feature renderers should also implement ILegendInfo, which provides access to a renderer's legend information and symbols. All ESRI feature renderers have at least one LegendGroup, which in turn has at least one LegendClass. Though feature renderers typically store all of the symbols used to draw features in their LegendClass objects, it is best to access these symbols via the specific renderer interface for the renderer object you are using. For example, for a ClassBreaksRenderer, use IClassBreaksRenderer.Get/SetSymbol, or for a ProportionalSymbolRenderer use IProportionalSymbolRenderer.Get/SetMinSymbol and IProportionalSymbolRenderer.Get/SetBackgroundSymbol. Also note that though ILegendInfo is also implemented by most layer coclasses, layers typically defer all methods and properties to the renderer's implementation.
Raster renderers
Raster renderers are used to symbolize raster layers. The following table shows the available raster renderer coclasses:
|
Raster renderer
|
Use
|
|
RasterClassifyColorRampRenderer
|
Pixels are drawn with graduated color symbolization based on their value. The data value range is divided into classes, each pixel having membership in one of these classes based on its value. Pixels are drawn with the color corresponding to their class.
|
|
RasterColormapRenderer
|
The raster layer is drawn based on a color map.
|
|
RasterRGBRenderer
|
This renderer is for drawing raster layers in true color red, green, and blue (RGB). The renderer draws three bands of a raster dataset, one for each of the red, green, and blue channels.
|
|
RasterStretchColorRampRenderer
|
This renderer is for rasters with continuous values. The raster layer is drawn using a color ramp stretched across these values.
|
|
RasterUniqueValueRenderer
|
Pixels are drawn with a different color for each unique value in the raster layer.
|
Accessing raster renderers
Each raster layer is assigned one raster renderer. To get a raster renderer object from a layer, use IRasterLayer.GetRenderer. To set a raster renderer to a layer, use the same method. In the case where you have a RasterCatalogLayer, use IRasterCatalogLayer.GetRenderer instead.
RasterRenderer abstract class
All raster renderer coclasses inherit from the abstract class, RasterRenderer. Developers can implement their own raster renderer by implementing all of the interfaces implemented by this class.
RasterRenderer implements IRasterRenderer, which provides access to properties and methods common to all raster renderers. This base class also implements persistence interfaces that allow raster renderers to be saved and loaded from disk as part of .lyr and .mxd files. Raster renderers implement ILegendInfo, which provides access to a renderer's legend information and symbols. ESRI raster renderers typically store the symbols they use to draw raster data in LegendClass objects which can be accessed via ILegendInfo. However, when writing client code that works with a raster renderer, it is best practice to access and change a renderer's symbols using the interface specific to the renderer you are using. For example, if working with a RasterUniqueValueRenderer, use IRasterUniqueValueRenderer.SetSymbol or if you are using a RasterStretchColorRampRenderer, use IRasterStretchColorRampRenderer.SetColorRamp. Although ILegendInfo is also implemented by most layer coclasses, layers typically defer all methods and properties to the renderer's implementation.
All raster renderers also expose display properties and methods through IDisplayAdmin and IRasterDisplayProps.
TIN Renderers
TIN renderers are used to symbolize TIN layers. A number of different TIN renderer coclasses are available. Each TIN layer can be symbolized by more than one of these objects at the same time. The ESRI TIN renderer objects are divided into renderers that symbolize nodes, edges, and faces. See the following table:
|
TIN renderer
|
Use
|
| TinNodeRenderer | Draws TIN nodes |
| TinNodeValueRenderer | Draws TIN nodes to show node values |
| TinNodeRenderer | Draws TIN nodes |
| TinNodeElevationRenderer | Draws TIN nodes to show elevation |
| TinEdgeRenderer | Draws TIN edges |
| TinBreaklineRenderer | Draws TIN edges to show breaklines |
| TinFaceRenderer | Draws TIN faces |
| TinFaceValueRenderer | Draws TINs at face value |
| TinElevationRenderer | Draws TIN faces to show elevation |
| TinSlopeRenderer | Draws TIN faces to show slope |
| TinAspectRenderer | Draws TIN faces to show aspect |
Accessing TIN renderers
Two TIN renderers are added by default when you load a TIN layer or a new layer is created, in MapBean or SceneBean. In ArcObjects, the default renderers are a TinEdgeRenderer and a TinElevationRenderer, while in ArcScene (at ArcGIS 9.0 and later versions), the default renderers are a TinEdgeRenderer and a TinFaceRenderer. In versions prior to ArcGIS 9.0, SceneBean creates a TinEdgeRenderer and a TinElevationRenderer by default.
A TIN layer keeps a collection of TIN renderers and to get these use ITinLayer. The following code example shows the name of each renderer used by a TIN Layer:
[Java]
public void rendererReport(){
    try{
        IMap map = mapDoc.getActiveView().getFocusMap();
        ITinLayer tinLayer = (ITinLayer)map.getLayer(0);
        ITinRenderer renderer = null;
        for (int i = 0; i < tinLayer.getRendererCount(); i++)
        renderer = tinLayer.getRenderer(i)
    }
    catch (Exception e){
        e.printStackTrace();
    }
}
You can add multiple renderers, even of the same general type—node, edge, and face—to a TIN layer's renderer collection. However, when two ore more renderers of the same type are added, there can be a conflict and it is the order in which you add your renderers that resolves this conflict. Also, in the ArcGIS user interface, use the TIN layer properties dialog box's Symbology tab to toggle on and off the various TIN renderers assigned to a layer.
TinRenderer abstract class
All TIN renderer coclasses inherit from the abstract class, TinRenderer. Developers can implement their own TIN renderer by implementing all of the interfaces implemented by this class.
TinRenderer implements ITinRenderer which provides access to properties and methods common to all TIN renderers. This base class also implements persistence interfaces that allow TIN renderers to be saved and loaded from disk as part of .lyr and .mxd files. TIN renderers also implement ILegendInfo, which provides access to a renderer's legend information and symbols. ESRI TIN renderers typically store the symbols they use to draw TIN data in LegendClass objects, which can be accessed via ILegendInfo. However, when writing client code that works with a TIN renderer, it is best practice to access and change a renderer's symbols using the interface specific to the renderer you are using. For example, if working with a TinNodeValueRenderer, use ITinUniqueValueRenderer or if you are working with a TinSlopeRenderer, use ITinColorRampRenderer.SetSymbol. Although ILegendInfo is also implemented by most layer coclasses, layers typically defer all methods and properties to the renderer's implementation.
Labeling
One of the key factors in creating a usable map is labeling (or annotating) features on the map. Labeling is the placing of text near a feature to purvey information about that feature. Normally, the label is based on attribute values of the feature, but it isn't necessary.
The ArcGIS labeling environment offers a wide variety of methods for labeling features and resolving conflicts when labels overlap. The labeling environment includes the ability to specify the features to be labeled (all features, features identified by a Structured Query Language [SQL], and so on); the expression that is used to label them (expressions can be simple or complex based on VBScript and JScript); placement options and weights for those placements; and priority specifications of one layer versus another. Depending on the requirements of the user, it is also possible to label one layer with multiple expressions.
The objects in this model provide the ability to access all of the parameters associated with the labeling of features. Advanced developers can also create their own expression-parsing engines to be used in the labeling process.
The AnnotateLayerPropertiesCollection holds a collection of the different labeling sets (LabelEngineLayerProperties objects) assigned to a particular feature layer. It is possible to label a layer with more than one expression. The purpose of the AnnotateLayerPropertiesCollection object is to keep track of the set of expressions that have been assigned.
The IAnnotateLayerPropertiesCollection interface allows for the manipulation of the IAnnotateLayerProperties (LabelEngineLayerProperties coclass) objects held in the collection. Through the interface, the developer can add, remove, sort, and query the objects in the collection.
QueryItem provides access to the items in the collection, as well as the placed and unplaced elements that go with each LabelEngineLayerProperties object.
A LabelEngineLayerProperties object maintains the set of properties associated with the labeling of a feature layer. Multiple LabelEngineLayerProperties can be created for a single feature layer and are stored in an AnnotateLayerPropertiesCollection. The object keeps track of which features to label, how to label them, what symbology to use, how to transform the labels based on the current scale, and what to do with unplaced labels.
The IAnnotateLayerProperties interface is implemented only by the LabelEngineLayerProperties object and provides the answer to the question of which features to label and at what scales. Through this interface, the developer can specify the priority of the labels, a where clause to be applied to the feature layer, and a specification of what to do with unplaced elements.
The FeatureLinked, LabelWhichFeatures, and GraphicsContainer properties apply only when the set of labels is being converted to annotation. The developer can use the GraphicsContainer property to specify where the converted labels go.
The FeatureLayer property is used internally during the labeling process. If you find it necessary to set this property, set it back to null after labeling has completed.
The IAnnotateLayerTransformationProperties interface is implemented only by the LabelEngineLayerProperties object; it holds the settings that determine what size to draw the labels at different scales. Use this interface when you want to specify the reference scale and other transformation properties to use with a LabelEngineLayerProperties object.
The ScaleRatio is a ratio between the IAnnotateLayerProperties.GetExtent value and the IAnnotateLayerTransformationProperties.
The ILabelEngineLayerProperties interface is implemented by the LabelEngineLayerProperties object and provides access to the expression, symbol, and overposting properties of the label engine object. Use this interface when you want to access the AnnotationExpressionEngine and BasicOverposterLayerProperties objects associated with the label engine object.
By default, the ExpressionParser property returns the AnnotationVBScriptEngine object. In general, the developer would not use this property unless they wanted to use Java scripting for labeling. In this case, an AnnotationJScriptEngine object is created and the ExpressionParser property is set to this. The expression to use is always set through the Expression property.
The IsExpressionSimple property identifies whether a complex expression is being used in the Expression property. Complex expressions involve a parser object (ExpressionParser property) to parse the string.
The SymbolID property is used during the conversion of labels to annotation when a symbol collection in the AnnotationFeatureClassExtension is referenced.
More precise control of the labeling properties can be obtained by accessing the BasicOverposterLayerProperties of the LabelEngineLayerProperties object. You can create the BasicOverposterLayerProperties object or you can retrieve it from the ILabelEngineLayerProperties.GetBasicOverposterLayerProperties property.
The IBasicOverposterLayerProperties interface is implemented only by the BasicOverposterLayerProperties object—it provides access to the overposting resolution methods employed by the label engine object. Each set of labeling properties defines how conflict resolution (overposting) issues will be resolved for those labels. The IBasicOverposterLayerProperties interface provides access to most of these properties.
FeatureType specifies whether labeling is being performed on point, line, or polygon features. Be sure to check this property before accessing any feature type specified property, such as LineLabelPosition or PointPlacementAngles.
FeatureWeight specifies whether labels can be placed on top of the features in a layer, while LabelWeight specifies whether the labels can conflict with other labels. The NumLabelsOption indicates how many labels to place per feature.
The IBasicOverposterLayerProperties2 interface is implemented by the BasicOverposterLayerProperties object and was added to allow you to set the maximum distance a label can be placed from its target (MaxDistanceFromTarget property). This property is only used when the label engine is used to place chart symbols. The IBasicOverposterLayerProperties3 interface was added to provide access to point rotation labeling capabilities. The IBasicOverposterLayerProperties4 interface was added to provide access to polygon labeling properties.
The IOverposterLayerProperties interface is implemented by the BasicOverposterLayerProperties object and provides access to whether labels or symbols are placed. The label engine only places symbols when it is used to place chart symbols, at which point these properties are controlled by the chart renderer.
The IsBarrier property indicates whether the features in the layer should serve as barriers for label placement (do not put labels on top of the features).
Annotation
Annotation in ArcGIS is enabled through the use of a feature class extension. The AnnotationFeatureClassExtension is used to configure the drawing properties and symbology for annotation features. Annotation feature classes are created using methods on the IAnnotationLayerFactory interface on the FDOGraphicsLayerFactory object.
Annotation feature class extension
Annotation features persist and draw text or graphic elements stored in the geodatabase. An annotation feature class (AnnoClass) can be feature linked or stand-alone. Feature linking allows the text of the annotation to be derived from the value of a related feature. The lifetime of the annotation is also controlled by the lifetime of the related feature. The IAnnotationClassExtention interface is used to access the properties of the annotation feature class extension. Commonly accessed properties are AnnotationLayerProperties and SymbolCollection.
Annotation features can persist (store) an entire symbol inline or reference a symbol in a symbol collection. These two persistence mechanisms balance performance with flexibility.
Storing the symbol inline allows the modification of the symbol on a feature instance basis. Unfortunately, this method dramatically increases the size of a row and can cause performance degradation when drawing large numbers of features in a multiuser environment.
A more efficient but less flexible alternative is to use symbols in the SymbolCollection of the AnnotationFeatureClassExtension. There symbols are stored as a property of the AnnotationFeatureClassExtension. The annotation feature stores an ID that references a symbol in the extension's SymbolCollection. TextElements are linked to symbols in the symbol collection by using the ISymbolCollectionElement interface on the TextElement. A small number of commonly changed attributes can be overridden with no minimal performance penalties using the ISymbolCollectionElement interface. Once an annotation feature has an element with a collection symbol, it is important that the symbol is not removed or modified in the SymbolCollection.
The IAnnoClassAdmin3 interface is used to update the properties of the class. In a versioned geodatabase, these properties apply to all versions and are not versioned. After creating an annotation feature class, modifying these properties can cause problems with the drawing and selection of annotation features. Adding new symbols to the SymbolCollection or changing the AutoCreate, UpdateOnShapeChange, OverposterProperties, and RequireSymbolID properties are the only recommended modifications. Deleting or modifying symbols in the SymbolCollection requires updating all annotation features whose elements reference the group symbol. When adding new symbols to the SymbolCollection, use the AddSymbol method of ISymbolCollection2, which automatically assigns a unique ID to the symbol. As with any schema related change, it is recommended that an exclusive schema lock be obtained before calling the UpdateProperties method.
The AllowSymbolOverrides property indicates if an annotation may override a symbol property even though it references the symbol collection. If set to false, only the AnchorPoint, Background, and TextPath of the text symbol can be modified. Modifications of these properties should be performed using ISymbolCollectionElement. This property is best employed in conjunction with RequireSymbolID and is used to limit the properties of an annotation feature that can be edited for either database efficiency of institutional reasons.
OverposterProperties indicates which label engine is to be used by the annotation feature class to generate and update feature linked annotation.
The RequireSymbolID property indicates if annotation features are required to reference a symbol in the symbol collection. Referencing a symbol in the symbol collection is the most efficient way to store annotation features. If a symbol does not reference a symbol in the symbol collection, the text symbol is inefficiently stored inline with the feature in the feature's blob field. Setting this property ensures that features reference a symbol in the symbol collection and are therefore efficiently stored. To avoid separating annotation features from their referenced symbol, modify the properties of each annotation element using ISymbolCollectionElement. These interfaces allow access to the properties of an annotation feature class that can be overridden. Setting AllowSymbolOverrides to false greatly reduces the number of properties that can be overridden.
Annotation feature
The AnnotationFeature persists and draws GraphicElements stored in the geodatabase. For labeling, a TextElement is used. Annotation features can be linked to features in a related FeatureClass.
The IAnnotationFeature interface is used for relating AnnotationFeatures to other features or updating the graphic of the annotation. The Annotation property accepts any GraphicElement. If a TextElement is used, a group symbol can be assigned by using the IGroupSymbol interface. A TextElement that does not reference a symbol in the symbol collection will have a group symbol ID of –1.
To relate an AnnotationFeature to another feature (a RelationshipClass must already exist), assign the ObjectID (OID) of the related feature to the LinkedFeatureID property. If the AnnotationFeature is not linked, the LinkedFeatureID property is –1. After updating either of these properties, call the IFeature.Store methods.
The IAnnotationFeature2 interface provides access to the AnnotationClassID and status of the annotation feature. You may want to update the status of an annotation feature from unplaced to placed after altering it.
Dimensions
Dimensions are a special kind of map annotation that show specific lengths or distances on a map. A dimension can indicate the length of the side of a building or land parcel or the distance between two features, such as a fire hydrant and the corner of a building. Dimensions can be a piece of text with a leader line or more elaborate. In the geodatabase, dimensions are stored in dimension feature classes.
Like other feature classes in the geodatabase, all features in a dimension feature class have a geographic location and attributes and can be inside or outside of a feature dataset. Like annotation features, each dimension feature knows what its symbology is and how it should be.
Dimensions in ArcGIS are enabled through the use of a feature class extension. The DimensionClassExtension is used to configure the drawing properties and symbology for annotation features. Annotation feature classes are created using methods on the IAnnotationLayerFactory interface on the FDOGraphicsLayerFactory object.
Dimension class extension
The IDimensionClassExtension interface provides access to the DimensionStyles collection and the reference scale drawing properties. The ReferenceScale property defines the scale at which symbols are drawn (at their defined size).
The ReferenceScaleUnits property is only used when the DimensionFeatureClass spatial reference is unknown. Changing the ReferenceScale after the feature class contains features is not recommended, as those features' geometries are controlled by the ReferenceScale property.
After making changes to any of the IDimensionClassExtension properties, call the UpdateProperties method. Changes can also be discarded by calling the ResetProperties method if UpdateProperties has not been called. As with any schema related modification, obtain an exclusive schema lock on the feature class before calling UpdateProperties.
Dimension styles
The DimensionStyles coclass is used to retrieve, create, and delete the DimensionStyles coclass.
The IDimensionStyles interface provides methods and properties for managing DimensionStyle objects.
To add a new DimensionStyle object, create a new DimensionStyle coclass, modify it, and call the Add method. When a style is added, a StyleID is automatically assigned to that style.
The DefaultStyleID property specifies which style should be used by default in ArcObjects. DimensionStyle objects can be retrieved by ID or name using the GetStyle and FindStyle methods.
Existing DimensionStyle objects can be renamed using the Rename method. Styles can only be deleted and not modified.
If a DimensionStyle is deleted, it is important to reassign a new DimensionStyle to existing DimensionFeatures that reference the deleted style.
The DimensionStyle coclass supports three interfaces for managing the symbology, behavior, and text of a dimension.
The IDimensionStyle interface provides properties for identifying DimensionStyles coclass.
The ID property is read-only; it is assigned to a DimensionStyle when it is added to a DimensionStyles collection.
The Name property provides a label for the style and is set before adding a DimensionStyle to the DimensionStyles collection. The Name property must be unique in a DimensionStyles collection.
The IDimensionStyleDisplays interface is used to control the display properties of the various parts of a dimension.
The esriDimensionDisplay enumeration defines four values for use with several properties.
The MarkerFit property controls a dimension's behavior for fitting the text and label.
The esriDimensionMarkerFit enumeration defines three values.
Setting MarkerFit to esriDimensionMarkerFitTolerance moves markers outside of extension lines if the MarkerFitTolerance is exceeded. Setting MarkerFit to esriDimensionMarkerFitText moves markers to the outside if colliding with text. This option does not apply to custom text positions.
When the markers are moved because of a fit, a line will be drawn between the markers based on the DrawLineOnFit property. The BaselineHeight property specifies the height above the selected dimension at which new dimensions will be created.
The IDimensionStyleText interface contains properties that control how the text of a dimension is displayed. The Align property forces the text to align to the angle of the DimensionLine. If the Align property is false, the TextSymbol's angle is used.
The ConvertUnits property specifies whether or not the value of the text will be converted from the FeatureClass native units to the units of the DisplayUnits property.
The text can be formatted using the DisplayPrecision property and the TextDisplay property. The esriDimensionTextDisplay enumeration defines four values for formatting the text string.
The text string can also be determined from an expression specified in the Expression property. The expression can be a simple concatenation of column values and strings or a function written in scripting language.
The name of the parser for the expression is specified in the ExpressionParserName property. The currently available parsers are VBScript and JScript. The TextFit property determines where the text will be placed if it does not fit between the markers after they have been moved (due to marker fit settings).
The esriDimensionTextFit enumeration defines three values for this behavior.
When the markers are moved because of a fit, a line will be drawn between the markers based on the DrawLineOnFit property.
Dimension feature
The DimensionFeature coclass draws dimensions using a DimensionStyle coclass. The feature's DimensionShape determines the placement and length of the dimension.
The IDimensionFeature provides properties for setting the style and placement of a DimensionFeature.
The IDimensionFeature provides properties for setting the style and placement of a DimensionFeature.
The StyleID property should be a valid ID from the class' DimensionStyles collection. If the current ID is invalid, the DimensionFeature will draw its boundary in red.
The DimensionShape property defines the placement of the elements of a dimension. The location and size of the DimensionFeature are determined entirely by the DimensionShape; it is not necessary to use the IFeature.GetShape property.
The DimensionType property defines the type of the dimension as linear or aligned and affects how the Edit tool behaves with the DimensionFeature during shape modification.
The DimensionLineDisplay, ExtensionLineDisplay, and MarkerDisplay properties are values that override the values of the current DimensionStyle coclass.
A custom value for the DimensionFeature's text can be set using the CustomLength property and by setting the UseCustomLength property to true.
The DimensionShape coclass stores points for a dimension's measurements. The DimensionFeature and DimensionGraphic use DimensionShapes to draw and store dimensions.
The IDimensionShape interface supports properties for the definition of a dimension's location and measurement.
The BeginDimensionPoint and EndDimensionPoint properties define the dimension's measurement point.
The DimensionLinePoint property determines the height of the dimension line above the baseline.
To create a two-point dimension, the DimensionLinePoint must be the same value as the BeginDimensionPoint.
The ExtensionLineAngle property defines the angle between the dimension line and the extension line in degrees. The default angle is 90 degrees; oblique dimensions have angles less than or greater than 90 degrees.
The DimensionShape supports a custom text location using the TextPoint property.
For the default location of the dimension text, the TextPoint's IGeometry.GetIsEmpty method returns true.
Dimension graphic
The DimensionGraphic is used for dynamically rendering dimensions using a DimensionStyle and DimensionShape. The IDimensionGraphic interface provides methods and properties for drawing dimensions.
The Style property sets the DimensionStyle for the DimensionGraphic. The DimensionShape defines the location of the dimension's measurements and text.
The Length property returns the calculated length for the dimension. A custom length value can be specified using the CustomLength and UseCustomLength properties.
If the current DimensionShape contains a TextPoint that is not empty, the default location for the text is available through the GetDefaultTextPoint method.
Layers
Layers display geographic information on a map. A layer doesn't store the actual geographic data, but references the data contained in coverages, shapefiles, geodatabases, images, grids, and so on, and defines how to display this geographic data. Some layers do not refer to geographic data. For example, a GroupLayer refers to other layers and a CompositeGraphicsLayer stores graphics.
Each different type of layer object represents different types of data. Examples of layer objects include FeatureLayer, GraphicsLayer, RasterLayer, TinLayer, CoverageAnnotationLayer, and GroupLayer.
The following table shows brief description of each layer coclass and class in the Carto library:
|
Layer
|
Description
|
| CadAnnotationLayer | Displays computer-aided design (CAD) annotation |
| CadFeatureLayer | Displays CAD data as feature data |
| CadLayer | Displays CAD data as a CAD drawing |
| CompositeGraphicsLayer | A collection of graphic layers that behaves like a single layer |
| CoverageAnnotationLayer | Displays ArcInfo Workstation coverage annotation, PCArcInfo Coverage annotation, or SDE3 annotation |
| DimensionLayer | Displays geodatabase dimension features |
| DummyGraduatedMarkerLayer | Displays graduated marker legend items in the style gallery |
| DummyLayer | Displays legend items in the style gallery |
| FDOGraphicsLayer | Displays geodatabase annotation features |
| FDOGraphicsSublayer | Displays annotation features in a subset of a geodatabase annotation feature class |
| FeatureLayer | Displays vector features, for example, stored in geodatabase feature classes, shapefiles, and coverages |
| GdbRasterCatalogLayer | Displays raster catalog data stored in a geodatabase |
| GraphicsSubLayer | Graphic sublayer handed back by a CompositeGraphicsLayer |
| GroupLayer | A collection of layers that behaves like a single layer |
| IMSMapLayer | Displays IMS data |
| MapServerLayer | Displays ArcGIS Map Server data |
| RasterCatalogLayer | Displays raster catalog data |
| RasterLayer | Displays raster data |
| TinLayer | Displays TIN data |
| Topology | Displays a geodatabase topology as a layer |
Accessing layers
The Map object manages a collection of layers. You can use the Layer or Layers property on the IMap interface to get a reference to a layer. To determine the type of layer to which you have a reference, query for specific interfaces. For example, if the layer object supports the ITinLayer interface, you know it is a TinLayer object. Layers can be persisted separately from maps in layer files (.lyr).
Accessing a layer's underlying data
Depending on the type of layer you are working with, use a different interface to access the layer's underlying data source. In some cases this interface is different for each type of layer, for example, for a RasterLayer use IRasterLayer.GetRaster to access the underlying data for the layer. For layers that refer to feature data, you can use IGeoFeatureLayer.GetFeatureClass to access the underlying feature class for the layer. A GroupLayer has no direct data source; instead, it refers to other layers. Access these layers via ICompositeLayer.
Layer abstract class
All layers inherit from a Layer abstract class. The Layer class implements several interfaces: ILayer, IGeoDataset, ILayerGeneralProperties, IPublishLayer, IPersist, and IPersistStream.
The ILayer interface has a method to draw the layer and properties to define the extent of the layer, minimum and maximum display scale, spatial reference, name, supported draw phases, and the map tip text. There are also properties that indicate whether the layer is visible, valid, or cached, and whether or not the layer shows map tips. The Cached property indicates whether the layer requires its own display cache or not. If the Cached property is set to true, the map will give a separate display cache to the layer so it can be refreshed independently of all other layers. A tracking layer is a good example of a custom layer that sets the Cached property to true.
The SpatialReference property is used only for the map display; it does not change the spatial reference of the underlying data but carries the Map object's knowledge of the current on-the-fly projection back to the feature layer.
IGeoDataset specifies the extent and spatial reference of the underlying data. The SpatialReference property on IGeoDataset is read-only. The property is used to set the spatial reference of the map; the map's spatial reference is automatically set to the spatial reference of the first layer loaded.
ILayerGeneralProperties provides access to a text description for the layer and also properties for the previous maximum and minimum visibility scales for the layer. IPublishLayer provides access to properties and methods for publishing the layer using the ArcGIS Publisher extension. The persistence interfaces allow a layer to be saved and loaded from disk as part of a .lyr or .mxd file.
Creating a custom layer
You can write a custom layer to support an unsupported data type in ArcGIS or to change how a supported data type draws and behaves in ArcMap and the other ArcGIS applications.
In Java you cannot persist the custom layer.
MapServer
MapServer is a coarse-grained ArcObjects component allowing users to display and query ArcGIS map documents bound to a MapServer object. MapServer can be used in either desktop, intranet (local area network [LAN], wide area network [WAN]), or Internet development environments.
In a desktop environment, MapServer objects can be created in process within your application. You can use MapServer, as well as other coarse-grained objects as a shortcut for ArcObjects development. Operations with many lines of code may now take a few lines of code.
More typically, MapServer objects run in ArcGIS Server. When running in ArcGIS Server, MapServer objects can be accessed via the server's application programming interface (API) over Transmission Control Protocol/Internet Protocol (TCP/IP); on an intranet, or can be accessed over Hypertext Transfer Protocol (HTTP) using Simple Object Access Protocol (SOAP) Extensible Markup Language (XML);on an Internet.
Web applications and Web services
MapServer objects can be consumed by server-based Web applications. ArcGIS Server provides an Application Developer Framework (ADF) for both .NET and Java. Web applications run on Web servers that are on the same LAN as a geographic information system (GIS) server and access server objects via the Server API. This allows the developer to create a wide range of GIS Web applications using ArcObjects. The ADF includes a set of Web templates, Web controls, and ArcObjects proxies.
ArcGIS Server also includes a SOAP/XML toolkit that allows a MapServer object to be exposed as a Web service (HTTP connection). The Web service consumer can get the methods and types exposed by the MapServer Web service through its Web Service Description Language (WSDL). WSDL describes the definitions of SOAP requests and responses. They are part of the GIS server and are installed as part of the ArcGIS Server install under <install directory>\XMLSchema.
The following MapServer interfaces do not support SOAP/XML: IMapServerData, IMapServerLayout, and IMapServerObjects.
ArcGIS Desktop and ArcGIS Engine
ArcGIS Desktop and ArcGIS Engine developers can consume ArcGIS Server Web services using the ArcGIS Server Client API (AGSClient). AGSClient includes objects and methods for connecting to GIS servers directly (TCP/IP) or through Web service catalogs (HTTP). AGSClient differs from the Server API in that it restricts clients to calling only the coarse-grained methods on the server object and does not provide access to the fine-grained ArcObjects associated with the server object. The MapServer interfaces, IMapServerData, IMapServerLayout, and IMapServerObjects are not supported by AGSClient.
ArcGIS Desktop and ArcGIS Engine developers can also consume server objects via the Server API. If you want to work with a server object in a stateful manner or you want to work with the fine-grained ArcObjects, use the Server API. You can use the GISServerConnection to connect to the GIS server or you can obtain a reference to the ServerObjectManager through GISClient (TCP/IP connection only).
MapServer coclass
The MapServer coclass contains several interfaces with basic functions for displaying (IMapServer and IMapServerLayout) and querying (IMapServer and IMapServerData) an ArcGIS map document (.mxd or .pmf). Also, there are a number of associated MapServer objects that represent input and output parameters for methods on MapServer interfaces. For example, the IMapServer method ExportMapImage requires two inputs—a description of the map to be exported and a description of the output parameters. These inputs are captured in the MapDescription and ImageDescription objects.
Map and layer information objects
To access information about a map and its layers use the IMapServer method GetServerInfo. GetServerInfo returns a MapServerInfo object. Use the IMapServerInfo interface to access read-only information about a map (data frame). IMapServerInfo provides access to members describing the default state of a MapServer object, such as the name of the map, the background color, or the spatial extent of the map. This information cannot be changed without changing the state of the underlying fine-grained ArcObjects. See the following illustration:
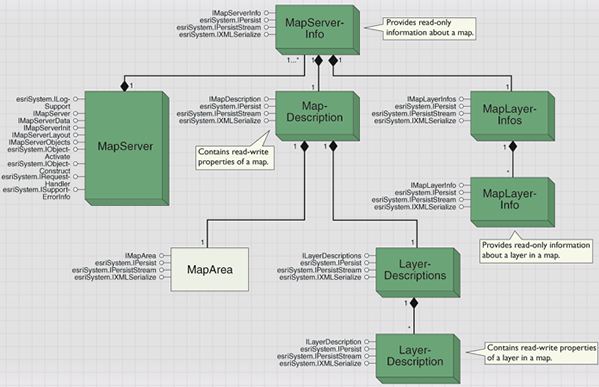
A MapServerInfo object contains a MapDescription. Use IMapDescription to access map settings that can be changed on the server object without changing the state of the underlying fine-grained ArcObjects that the map document is based on. The following are the differences between IMapServerInfo and IMapDescription:
- IMapServerInfo provides read-only access to its members.
- IMapDescription provides read-write access to its members. Use IMapDescription to access and change map settings without changing the state of the fine-grained ArcObejcts.
Layer settings can be retrieved from the IMapLayerInfo and ILayerDescription interfaces. Use the IMapLayerInfo interface to access read-only information about an individual layer in the map. Use the ILayerDescription interface to access read/write properties of a layer. The following are the differences between ILayerDescription and IMapLayerInfo:
- Use ILayerDescription to access layer settings that can be changed on the server object without changing the state of the underlying fine-grained ArcObjects that the layer is based on.
- Use IMapLayerInfo to retrieve information about a layer that can only be changed by accessing the map document or the fine-grained ArcObjects it is based on.
Exporting a map image
Use the ExportMapImage method on the IMapServer interface to export a map image. To specify the size and type of the output image, use the IImageDescription, IImageDisplay, and IImageType interfaces. MapServer supports all ArcGIS supported output types. ExportMapImage returns a MapImage object. The interfaces IMapImage, along with ILayoutImage inherit from IImageResult. See the following illustration:
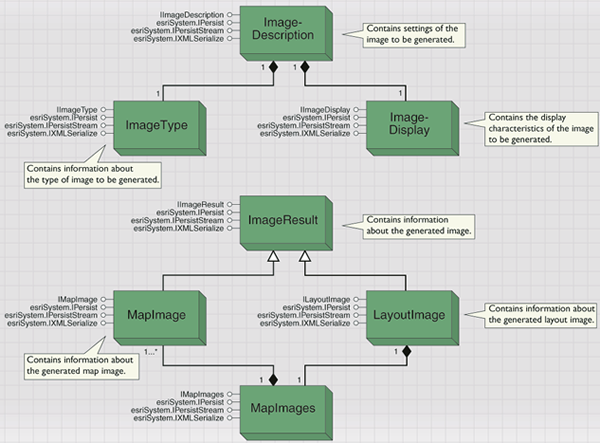
Querying the map
To perfom query operations on the map, IMapServer offers a number of methods. These include: Find, Identify, QueryHyperlinks, QueryFeatureCount, QueryFeatureData, and QueryFeatureIDs.
To control the amount of information MapServer needs to process for a query, a maximum number of records can be set. This value is contained in the MaxRecordCount property on IMapServerInit. It can be set there or if the MapServer object is being used in a server context, the MaxRecordCount can be changed by modifying the MaxRecordCount XML tag in the MapServer's configuration file. The default value for this property is 500. This setting does not affect QueryFeatureCount or QueryFeatureIds.
The Find method returns a MapServerFindResults object. This is a collection of MapServerFindResult objects. Use IMapServerFindResult to access properties of found features. See the following illustration:
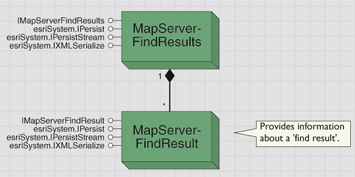
Identify returns a MapServerIdentifyResults object. This is a collection of MapServerIdentifyResult objects. Use IMapServerIdentifyResult to access properties of identified features. This includes rows associated to the feature through a table relationship. See the following illustration:
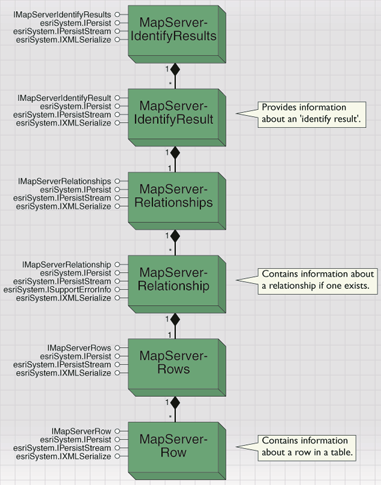
Map layouts and map surrounds
Use the IMapServerLayout interface to export an existing map layout, legend, north arrow, or a scale bar of an existing map. Also use IMapServerLayout to convert screen coordinates to page coordinates on the layout and vice versa. See the following illustration:
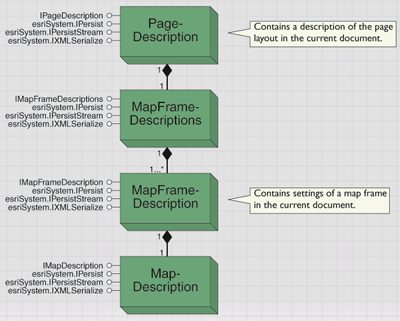
One of the requirements for the ExportLayout method on IMapServerLayout is a PageDescription object. The PageDescription contains a MapFrameDescriptions object, which is the collection of MapFrameDescriptions (data frames) present in the layout.
Some layout elements can change dynamically when accessed by IMapServerLayout. Data frames in the layout will reflect any changes in MapDescription. Scale bars, scale text, north arrows, and legends linked to data frames will adjust to these changes.
Do not use IMapServerLayout to create new layouts or to create layouts on-the-fly. You cannot change the page size of the map layout, reposition map elements on the layout, nor can you add or remove layout elements, such as titles, text, graphics, scale bars, north arrows, and legends. You must access finer-grained ArcObjects via IMapServerObjects to make these kinds of changes.
IMapServerLayout cannot be accessed through the ArcGIS Server Client API (AGSClient) or through SOAP/XML.
Individual legend elements
In addition to exporting a single image of the legend using IMapServerLayout, you can retrieve individual legend elements including the symbol images, labels, descriptions, and headings. A common use would be to populate a table of contents. To retrieve this legend information, use GetLegendInfo on IMapServer. This method returns a MapServerLegendInfos object, which is a collection of MapServerLegendInfo objects. By using these objects, you can retrieve only the parts of the legend you are interested in. See the following illustration:
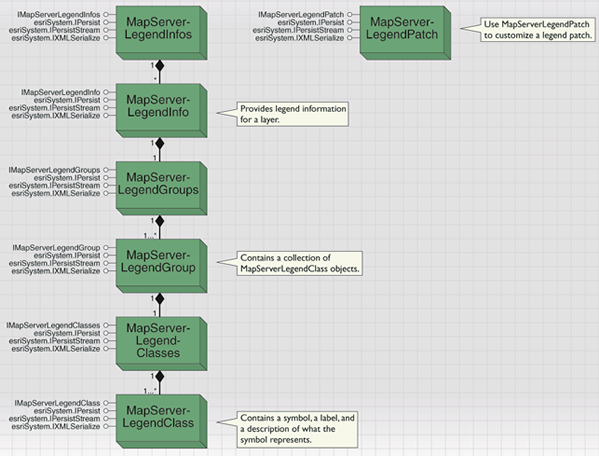
Accessing fine-grained ArcObjects
Though the methods and properties available through MapServer and its associated objects offer important mapping functionality, they cannot encapsulate all that ArcObjects offers. In many cases you may want to use other finer-grained ArcObjects in conjunction with MapServer. You can do this using the IMapServerObjects interface. Through this interface, you can access ILayer, IMap, and IPageLayout. For example, you can make changes to the map, such as adding a new layer, using IMap.
It is very important to distinguish between temporary and permanent changes to the MapServer object. A temporary change would include changes to the MapDescription or LayerDescription using IMapDescription and ILayerDescription. For example, you might change the geographic extent of a map (MapArea) or change the visibility of a layer (Visible). These changes can be temporary and valid for the duration of the call. Once the call has ended, the MapServer object returns to its default state.
Permanent changes to the MapServer object can be done in the following ways:
- Change the map document and restart the MapServer object.
- Use interfaces, such as IMapDescription and ILayerDescription and call the IMapServerObjects method ApplyMapDescription to update the state of the MapServer object.
- Access the underlying fine-grained ArcObjects using the methods on IMapServerObjects, make a change, such as adding a new layer or changing a layer's rendering, and call RefreshServerObjects to refresh the MapServer object with the current state held by the fine-grained ArcObjects.
IMapServerObjects cannot be accessed through the ArcGIS Server Client API (AGSClient) or through SOAP/XML. Calls into finer-grained ArcObjects must be done in a desktop environment or over a TCP/IP connection using the Server API.
ArcIMS layers, symbols, and renderers
The Internet is a vast resource for geographic data. Organizations can publish their data using ArcIMS and serve it over the Internet. The Geography Network, which also uses ArcIMS, provides easy access to data on the Internet. You can view this data as layers in ArcObjects. ArcIMS provides two types of map services: an ArcIMS Feature Service and an ArcIMS Image Service.
An ArcIMS feature service is similar to a feature dataset that contains many feature classes. Each ArcIMS feature class represents a unique entity; the actual features are streamed to the client. When you add a feature service to the map, a group layer consisting of one or more feature layers is also added to the map. You can work with feature layers based on ArcIMS feature services in ArcObjects the same way you work with feature layers based on local feature classes.
An ArcIMS image service is a raster representation of a complete map. When you add an image service to ArcObjects application, a new layer on the map displays. This layer is an Internet Map Server map layer (IMSMapLayer). You can turn off specific sublayers in the IMS map layer to view only the layers of interest.
An IMSMapLayer is a composite layer consisting of IMS sublayers. You can use the ICompositeLayer.GetLayer method to get a reference to an IMS sublayer; the sublayer is of type IIMSSubLayer. From that, you can get a reference to the ACLayer (Arc Connection layer) on which the sublayer is based. An ACLayer does not implement ILayer; rather, it is an XML representation of the layer from the Internet service. ACLayers use the symbology defined on the Internet service for display in MapBean.
The IIMSMapLayer interface indicates that the layer is an IMS map layer. The Connection property and Connect method manage the connection to the Internet service. The MoveSubLayerTo method allows you to rearrange the order of the sublayers in the IMSMapLayer. The IMSMap property returns a reference to the ACMap (Arc Connection map), which is an XML representation of the map that was served over the Internet.
A series of ArcIMS symbol and renderer objects exist in the Carto library to aide in the management of the display of IMSMapLayers. The objects maintain the relationship between the XML and display representations of the data. The IMSMapLayer manages this relationship and there is no need to access or modify these objects.
GPS support
The ArcObjects Global Positioning System (GPS) support classes and interfaces are located mainly in the Carto library. The main class is the RealTimeFeedManager. Through it, you can access and control a realtime feed from a GPS device or a simulated feed from a feature class. Use GpsFeed together with GpsConnection to control the connection to a GPS device. If you want to replay data logged earlier or other appropriate data, use RealTimeFeedSimulator. Both GpsFeed and RealTimeFeedSimulator support the IRealTimeFeed interface. All information on the current position can be accessed through this interface.
The RealTimeFeedManager provides access to IGpsDisplayProperties where you can customize how positions are displayed. The Show properties, such as ShowCurrentPosition, turn on or off various attributes of the current position or the marker trails including the altitude, bearing, or speed. You can set the minimum and maximum altitude and speed values plus set the minimum and maximum sizes of the symbols used for the altitude values. The symbology of the speed is set through SpeedColorRamp. RealTimeFeedManager has methods to refresh or clear the GPS display.
You can display previous positions with markers or a linear trail with IPositionTrails. The LinearTrailDistance and LinearTrailSymbol are the properties of a linear trail while MarkerTrailDistance, MarkerTrailCount, MarkerTrailSymbol and MarkerTrailColorRamp control various features of a marker trail. Turn trails on or off with the ShowMarkerTrails and ShowLinearTrails boolean properties. You can store positions in a feature class through the IRealTimeLog interface. The StartLogging and StopLogging methods turn logging on and off, respectively, while the StampGpsPosition method writes the current position to the log file. The LogFile properties defines the feature class to which positions will be logged. If you are streaming position to the log file, use the LogRate, MinimumLogDeflectionAngle, or the MinimumLogDistance to control which locations are written to the log file.
If you want to snap the current position to an existing layer, use IRealTimeFeedSnap. You can set the snapping distance, the layers to snap to, and whether to snap to nodes, lines, or vertices.
The following code example shows how to use RealTimeFeedManager:
[Java]
RealTimeFeedManager manager = new RealTimeFeedManager();
manager.getRealTimeFeedSimulator().setFeatureLayerByRef(new IFeatureLayerProxy
    (map.getLayer(1)));
manager.getRealTimeFeedSimulator().setTimeIncrement(1);
manager.setRealTimeFeedByRef(new IRealTimeFeedProxy(manager.getRealTimeFeedSimulator
    ()));
manager.setMapByRef(map.getMap());
manager.setAutoPan(false);
manager.setBaseMarkerSymbolByRef(symbol);
manager.setShowMarkerTrails(false);
manager.getRealTimeFeed().start();