ArcGIS for Desktop

  • Documentation
  • Tarification
  • Support

  • My Profile
  • Aide
  • Sign Out
ArcGIS for Desktop

ArcGIS Online

La plateforme cartographique de votre organisation

ArcGIS for Desktop

Un SIG professionnel complet

ArcGIS for Server

SIG dans votre entreprise

ArcGIS for Developers

Outils de création d'applications de localisation

ArcGIS Solutions

Modèles d'applications et de cartes gratuits pour votre secteur d'activité

ArcGIS Marketplace

Téléchargez des applications et des données pour votre organisation.

  • Documentation
  • Tarification
  • Support
Esri
  • Se connecter
user
  • Mon profil
  • Déconnexion

Help

  • Accueil
  • Commencer
  • Carte
  • Analyser
  • Gérer les données
  • Outils
  • Plus...

Understanding simple kriging

Disponible avec une licence Geostatistical Analyst.

Simple kriging assumes this model:

Z(s) = µ + ε(s)
  • where µ is a known constant

For example, in the following figure, which uses the same data as for ordinary kriging and universal kriging concepts, the observed data is given by the solid circles:
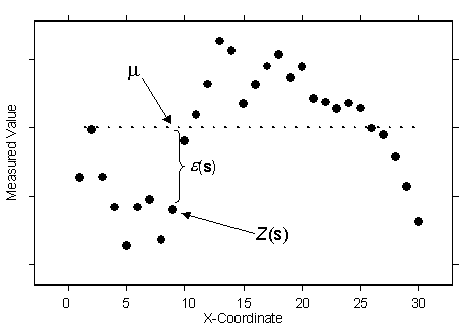
Ordinary kriging with one spatial dimension
Example of ordinary kriging with one spatial dimension

The known constant, represented by the dotted line, is µ. This can be compared to ordinary kriging. For simple kriging, because you assume that you know µ exactly, you also know ε(s) exactly at the data locations. For ordinary kriging, you estimated µ, so you also estimated ε(s). If you know ε(s), you can do a better job of estimating the autocorrelation than if you are estimating ε(s). The assumption that you will know the exact mean µ is often unrealistic. However, sometimes it makes sense to assume that a physically based model gives a known trend. Then you can take the difference between that model and the observations, called residuals, and use simple kriging on the residuals, assuming the trend in the residuals is known to be zero.

Simple kriging can use either semivariograms or covariances (which are the mathematical forms you use to express autocorrelation), use transformations, and allow for measurement error.

Thèmes connexes

  • ...to create a prediction map
  • ...to create a quantile map
  • ...to create a probability map
  • ...to create a prediction standard error map
  • Using simple kriging with a data transformation to create a prediction map
  • Using simple kriging with a data transformation and declustering to create a prediction map
Vous avez un commentaire à formuler concernant cette rubrique ?

ArcGIS for Desktop

  • Accueil
  • Documentation
  • Tarification
  • Support

ArcGIS Platform

  • ArcGIS Online
  • ArcGIS for Desktop
  • ArcGIS for Server
  • ArcGIS for Developers
  • ArcGIS Solutions
  • ArcGIS Marketplace

A propos d'Esri

  • A propos de la société
  • Carrières
  • Blog des initiés
  • Conférence des utilisateurs
  • Sommet des développeurs
Esri
© Copyright 2016 Environmental Systems Research Institute, Inc. | Confidentialité | Légal