Overview
Individual locations or pieces of geography often have greater importance, or more weight, if they are closer to an area of examination. For example, customers who live in a ZIP Code adjacent to a client's store are more likely to visit the store than potential customers who live in a ZIP Code five miles away. You may want to create distance decay trade areas that reflect the inverse relationship between distance and propensity to visit a location. Specifically, as distance increases, the geographic importance of a piece of geography within a study area diminishes.
In principle, distance decay trade areas are not different from a simple weighted area. Business Analyst distance decay functionality provides the mechanism to create these areas based on the geographic principle of distance decay: the propensity to visit a store decreases as the distance to the store increases. More simply, people are more likely to visit a store if they are closer to the location. Distance decay area calculates market penetration values for a number of ring or drive-time polygons around your stores. The Distance Decay Report shows you how far your customers are traveling to a store in comparison to a base value, such as population.
Input prerequisites
You must have store and customer layers with customer assignments already generated.
Output example
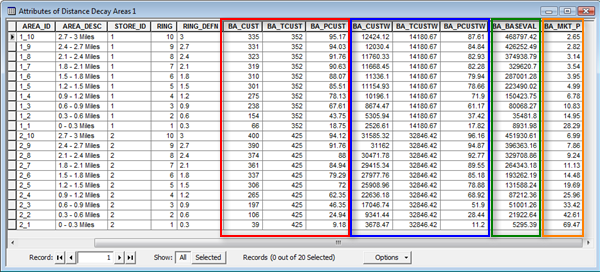
The graphic below shows distance decay output and descriptions of each relevant attribute field. The attributes in the AREA_DESC section indicate the distance units between rings.
The columns and numbers they contain in the image above are described below:
- AREA_ID - the distance units between rings.
- BA_CUST - the number of customers in each simple ring/drive time ring.
- BA_TCUST - the total number of customers for each current store.
- BA_PCUST - the percentage of customers (100*BA_CUST/BA_TCUST).
- BA_CSTW, BA_TCUSTW and BA_PCSUTW (in the blue box) - these fields have the same values as the fields to the left except that these are based on assigned weights rather than customer counts.
- BA_BASEVAL (in the green box) - the base value for calculating penetration (total market count) which can be total households or population.
- BA_MKT_P (in the orange box) - the market penetration (=100*BA_CUST/BA_BASEVAL).
