ArcGIS Desktop

  • ArcGIS Pro
  • ArcMap

  • My Profile
  • Help
  • Sign Out
ArcGIS Desktop

ArcGIS Online

The mapping platform for your organization

ArcGIS Desktop

A complete professional GIS

ArcGIS Enterprise

GIS in your enterprise

ArcGIS Developers

Tools to build location-aware apps

ArcGIS Solutions

Free template maps and apps for your industry

ArcGIS Marketplace

Get apps and data for your organization

  • Documentation
  • Support
Esri
  • Sign In
user
  • My Profile
  • Sign Out

ArcMap

  • Home
  • Get Started
  • Map
  • Analyze
  • Manage Data
  • Tools
  • Extensions

Controlling the axes of the graph

Graph axis characteristics can be managed from the Advanced Properties dialog box. The scales of the axis are set automatically when a series is added to the graph, and by default, the left and bottom axes will be enabled.

Using the Advanced Properties dialog box for a graph, it is possible to modify axis properties such as position, borders, margins, gradients, and shadows. You can access the Advanced Properties dialog box by right-clicking on a graph directly and clicking the Advanced Properties option. You can also open the dialog box in the Graph Manager.
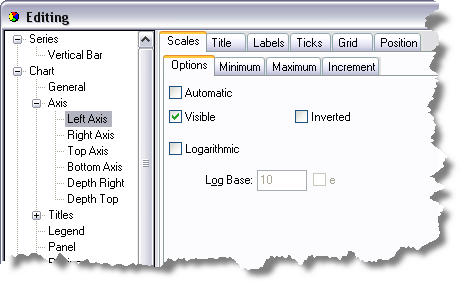
Advanced Properties dialog
  1. Click Axis under Chart.
  2. Choose the axis you want to modify from the Axes list.
  3. Click the Scales tab to set the scale (numeric range) for that axis.

    • By default, the Scale will be set to Automatic, and the best axis scale range is selected to fit the data. To define the scale yourself, click the Automatic setting off.
    • The major units of the scale can be altered by clicking the Change button and setting the desired increment.
    • The number of minor units in one major unit can be controlled by Count on the Minor tab.

  4. Click Close when done.
Note:
  • To set the properties of the axis title text, in the Advanced Properties dialog box choose the axis to modify in the list, click the Title tab, click the Text tab, then open the font dialog box by clicking the Font button. To access more colors than are shown there, return to the Text tab and click the colored box to the right of the Font button.
  • The Labels tab of the Axis properties controls the style and appearance of the values that are used to label the axis.

Related topics

  • General properties of graphs

ArcGIS Desktop

  • Home
  • Documentation
  • Support

ArcGIS

  • ArcGIS Online
  • ArcGIS Desktop
  • ArcGIS Enterprise
  • ArcGIS
  • ArcGIS Developer
  • ArcGIS Solutions
  • ArcGIS Marketplace

About Esri

  • About Us
  • Careers
  • Esri Blog
  • User Conference
  • Developer Summit
Esri
Tell us what you think.
Copyright © 2021 Esri. | Privacy | Legal