Summary
Visualizes the variables stored in a netCDF cube created with the Create Space Time Cube tool and the Emerging Hot Spot Analysis tool. Output from this tool is a three-dimensional representation uniquely rendered based on the variable and theme chosen.
Illustration

Usage
This tool can only accept netCDF files created by the Create Space Time Cube tool.
To visualize the space-time cube in 3D, you must use either ArcGlobe or ArcGIS Pro. For optimal 3D visualization, ArcGIS Pro is recommended.
The VALUE theme allows you to see the raw numbers associated with aggregation.
If you have run Emerging Hot Spot Analysis on a particular variable, you also have the option of visualizing HOT_AND_COLD_SPOT_RESULTS. This theme shows you the statistical significance of each bin based on the space time hot spot analysis run in Emerging Hot Spot Analysis .
Any Summary Fields that were aggregated will also have the option of visualizing the ESTIMATED_BINS so you can see exactly which bins were estimated based on your decisions in Create Space Time Cube.
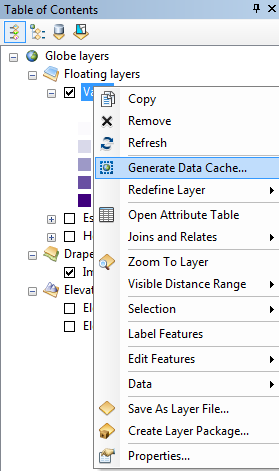
If the data is not drawing, you may need to manually generate the data cache. You can do this by right-clicking the output layer and selecting Generate Data Cache. When the Generate Cache window pops up, click OK.

Syntax
VisualizeSpaceTimeCube3D(in_cube, cube_variable, display_theme, output_features)
| Parameter | Explanation | Data Type |
in_cube | The netCDF cube that contains the variable to be displayed. This file must have an .nc extension and must have been created using the Create Space Time Cube tool. | File |
cube_variable | The numeric variable in the netCDF cube that you want to explore. The cube will always contain the COUNT variable. Any Summary Fields in the cube will also be available if they were included in the cube creation process. | String |
display_theme | The characteristic of the Cube Variable that you want to display. VALUE will always contain an option for every cube. ESTIMATED_BINS are only available for the Summary Fields that were included in the cube creation process. HOT_AND_COLD_SPOT_RESULTS will only be available for Cube Variables for which Emerging Hot Spot Analysis has been run.
| String |
output_features | The output feature class results. This feature class will be a three-dimensional map representation of the display variable chosen that can be displayed in a 3D scene. | Feature Class |
Code sample
VisualizeSpaceTimeCube3D example 1 (Python window)
The following Python window script demonstrates how to use the VisualizeSpaceTimeCube3D tool.
arcpy.env.workspace = r"C:\STPM"
arcpy.VisualizeSpaceTimeCube3D_stpm("Homicides.nc", "COUNT", "HOT_AND_COLD_SPOT_RESULTS", "Homicides_Count_HS.shp")
VisualizeSpaceTimeCube3D example 2 (stand-alone Python script)
The following stand-alone Python script demonstrates how to use the VisualizeSpaceTimeCube3D tool.
# Display Space Time Cube of homicide incidents in a metropolitan area

# Import system modules
import arcpy

# Set geoprocessor object property to overwrite existing output, by default
arcpy.overwriteOutput = True

# Local variables...
workspace = r"C:\STPM"

try:
    # Set the current workspace (to avoid having to specify the full path to the feature classes each time)
arcpy.env.workspace = workspace

# Display Space Time Cube of homicide with the hot and cold spots with crime counts
# Process: Visualize Space Time Cube in 3D
cube = arcpy.VisualizeSpaceTimeCube3D_stpm("Homicides.nc", "COUNT", "HOT_AND_COLD_SPOT_RESULTS", " Homicides_Count_HS.shp")

except:
    # If any error occurred when running the tool, print the messages
    print(arcpy.GetMessages())
Environments
Licensing information
- ArcGIS Desktop Basic: Yes
- ArcGIS Desktop Standard: Yes
- ArcGIS Desktop Advanced: Yes