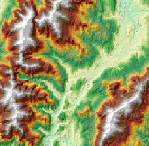
A color 3D representation of the terrain, created by merging the images from the Elevation-coded and Hillshade methods. This function uses the altitude and azimuth properties to specify the sun's position.

The inputs for this function are the following:
- Input Raster
- Color Ramp or Colormap
- Azimuth
- Altitude
- Scaling
- Z Factor
- Pixel Size Power
- Pixel Size Factor
- Remove Edge Effect
Color Ramp or Colormap
Choose whether to use a color ramp, or a colormap. If you choose the color ramp option, then you can choose an appropriate color ramp to display your shaded relief. If you choose colormap, then you need to specify the colormap file to use.
Azimuth and Altitude
The properties altitude and azimuth together indicate the sun's relative position that will be used for creating any 3D model (hillshade or shaded relief). Altitude is the sun's angle of elevation above the horizon and ranges from 0 to 90 degrees. A value of 0 degrees indicates that the sun is on the horizon, that is, on the same horizontal plane as the frame of reference. A value of 90 degrees indicates that the sun is directly overhead.

Azimuth is the sun's relative position along the horizon (in degrees). This position is indicated by the angle of the sun measured clockwise from due north. An azimuth of 0 degrees indicates north, east is 90 degrees, south is 180 degrees, and west is 270 degrees.
Scaling and Pixel Size
The shaded result is scaled dynamically by adjusting the z factor using one of two options:
- None—This applies a linear adjustment by modifying the z factor according to the cell size, thereby accounting for altitude changes (scale) as the viewer zooms in and out. This is ideal for single raster datasets covering a local area. This is not recommended for worldwide datasets as it will produce a fairly flat (gray) image when zoomed out.
- Adjusted—This applies a nonlinear adjustment using the default Pixel Size Power and Pixel Size Factor values, which accounts for the altitude changes (scale) as the viewer zooms in and out. These values are recommended when using the worldwide dataset.
The z factor is adjusted using the following equation:
Adjusted Z Factor = (Z Factor) + (Pixel Size)Pixel Size Power × (Pixel Size Factor)
Z Factor
The z-factor is a scaling factor used to convert the elevation values for two purposes:
- To convert the elevation units (such as meters or feet) to the horizontal coordinate units of the dataset, which may be feet, meters, or degrees.
- To add vertical exaggeration for visual effect.
Unit conversion
If the units for the z (elevation) units are the same as the x,y (linear) units, then the z conversion factor is 1. If your dataset is using a projected coordinate system, your scaling is set to None, and your elevation and linear units are different, then you will need to define a z conversion factor to account for the difference.
To convert from feet to meters or vice versa, see the table below. For example, if your DEM's elevation units are feet and your mosaic dataset's units are meters, you would use a value of 0.3048 to convert your elevation units from feet to meters (1 foot = 0.3048 meters).
Conversion factor between feet and meters
| From | To | ||
|---|---|---|---|
Feet | Meters | ||
Feet | 1 | 0.3048 | |
Meters | 3.28084 | 1 | |
If your data is using a geographic coordinate system (such as a DTED in GCS_WGS 84), where the linear units are in degrees and your elevation is in meters, use a conversion factor of 1, and the system will automatically convert your linear degrees to meters. If your elevation units are not in meters, use the Arithmetic function to convert your elevation to meters before using this function.
Vertical exaggeration
To apply vertical exaggeration, you must multiply the conversion factor by the exaggeration factor. For example, if both elevation and dataset coordinates are meters and you want to exaggerate by a multiple of 10, the scaling factor would be the unit conversion factor (1.0) multiplied by the vertical exaggeration factor (10.0)—which would be a Z-Factor of 10. If the elevation units are meters and the dataset is geographic (degrees), you would multiply the unit conversion factor (1.0) by the exaggeration factor (10.0)—which would be a Z-Factor of 10.
Remove Edge Effect
Using this option will avoid any resampling artifacts that may occur along the edges of a raster. The output pixels along the edge of a raster or beside pixels without a value will be populated with NoData; therefore, it is recommended that this option be used only when there are other rasters with overlapping pixels available. When overlapping pixels are available, these areas of NoData will display the overlapping pixel values, instead of being blank.
- Unchecked—Bilinear resampling will be applied uniformly to resample your shaded relief. This is the default.
- Checked—Bilinear resampling will be used within the shaded relief, except along the edges of the rasters or beside pixels of NoData. These pixels will be populated with NoData, since it will reduce any sharp edge effects that may occur.