This case study follows Mark and Lisa as they investigate whether or not to sell their home. Is it practical? How much can they get for their existing home? Where should they look for a great new home?

Mark and Lisa are thinking about selling their home. It was perfect when it was just Lisa and two naughty dogs. After Mark and Lisa got married, however, the family grew to include a third dog and visiting adult children with their families. It was about the 15th time Mark commented on the benefits of a two-car garage and larger closets that they started thinking seriously about finding a new home. Unfortunately, Mark and Lisa have no idea how much they might be able to get for their house. Lisa bought it for $355,000 in 2005 when home prices in Crestline, California were nearing their peak. Prices have been up and down ever since. They are hoping they won't have to sell at a loss.

Have home values appreciated?
Mark and Lisa download ZIP Code level Zillow data for 3-bedroom homes like theirs, and create a line graph showing home price trends. Clicking at the beginning of the line graph they see that the estimated median home values for the month and year they bought their home was $316,000. Clicking at the end of the line graph they see current estimated median home values are $243,900. This is not good news. Homes have depreciated. To see how much they have depreciated, they divide the current average selling price by the average selling price when they bought the home: 243900/316000 = 0.77. It seems that homes in their ZIP Code (Crestline, CA) are only worth 77 percent of what they were when the home was purchased. 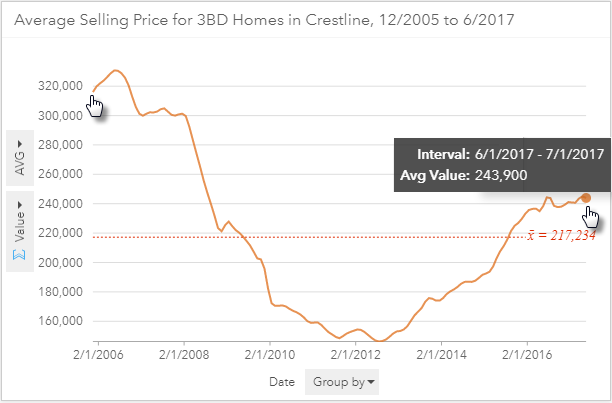
What is a good asking price?
To get a rough estimate of an appropriate asking price, they sum what they paid for their home with the money they have invested in solid home improvements, and multiply the sum by the rate of depreciation: (($355,000 + $100,000) * 0.77). This gives them a suggested selling price of $350,350. Mark and Lisa are discouraged but will investigate further.

Is it a buyer's or a seller's market?
If Mark and Lisa's home is in a seller's market location, they will have a better chance of getting their asking price. In a strong seller's market, homes sell fast. There are more potential buyers than there are homes available, so buyers must move quickly and make their offers attractive. In a buyer's market, there are more homes available than potential buyers. Many homes sit for a long time before any potential buyers even look at them.
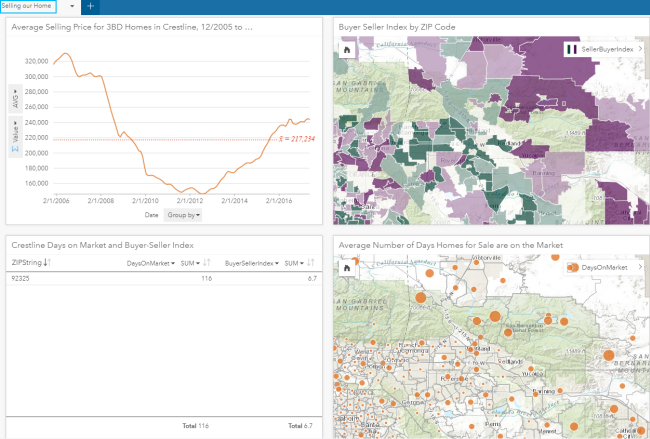
Mark and Lisa download ZIP Code level data from Zillow with a buyer-seller index ranging from 0 (strong seller's market) to 10 (strong buyer's market). This dataset also contains the average number of days the homes in each ZIP Code are on the market before they sell.
They learn that the buyer-seller index for Crestline is 6.7: a buyer's market unfortunately. The data also show it takes 116 days, on average, for homes to sell in their ZIP Code.

If they do decide to sell their home, it looks like they will be selling at a loss.
Lisa is ready to give up. She loves their home in the mountains and is excited about fixing it up to make Mark love it too. That's when Mark introduces a new angle: what if they could find a home for about the same price, with better investment potential?
Which ZIP Codes are close to both workplaces?
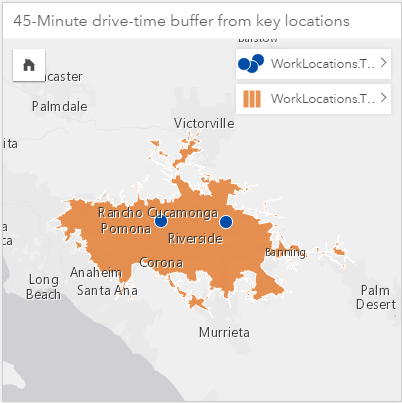
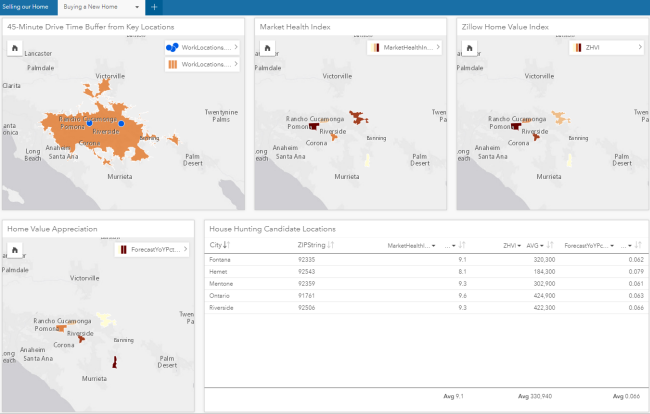
Mark and Lisa decide to explore the investment potential of homes close to their jobs. They create an Excel file with the addresses for both of their work locations. They could have included other important places, such as addresses of friends and family, favorite recreation spots, schools, and so on, but they decide to start with their jobs. Neither is willing to spend more than 45 minutes commuting to work. They create a drive-time buffer showing what this looks like.
Which areas offer the best investment opportunity?
Having narrowed the home search area, they are ready to explore home investment potential.
In addition to estimates of median home values, Zillow provides data for market health and projected home value appreciation. Mark and Lisa create maps of this data for the ZIP Codes that fall within their 45-minute drive-time buffer.
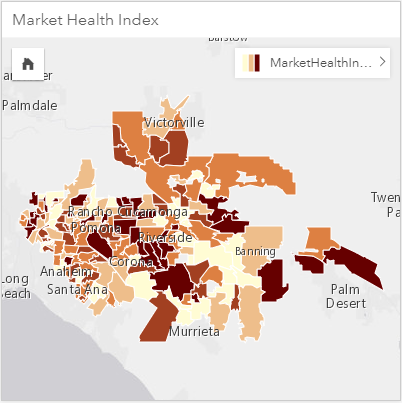
The map below shows market health. This metric captures home value rebounds and declines, the average time it takes homes to sell, and the financial health of homeowners. The darkest areas on the map have the best market health. Mark and Lisa notice that the Crestline real estate market, where they currently live, is somewhat healthy (5.2 on a scale from 0 to 10 where the mean is 6.7 for ZIP Codes within 45 minutes drive of their work locations).
They look at projected home appreciation values. This forecasted year-over-year percent change in estimated median home values considers housing inventories and foreclosures. They notice that the Crestline area, where they currently live, is expected to appreciate (increase) 4.8 percent next year. The darkest areas on the map are projected to appreciate more than 6 percent.

Mark and Lisa are looking for homes with an estimated median home value between $300,000 and $600,000, in a healthy real estate market, with high projected home value appreciation. They enter these criteria and find five ZIP Codes to explore further: Fontana, Hemet, Mentone, Ontario, and Riverside.
They can now use real estate websites such as Zillow.com or Realtor.com to see if they can find a new home, for about the same price as their current home, with better investment potential.
This might take a while; Lisa is going to be hard to please.
Are you ready to find your great new home?
