Where grazing allotments meet watersheds
The department of environmental quality wants to monitor the impact of livestock grazing on the state's water quality. Earlier studies by the department confirmed that sediment and animal waste can pollute streams that are located in grazing areas.
Much of the grazing in the state occurs on federal lands. The federal agencies have divided the grazing areas into allotments, and issue permits or leases to ranchers for individual grazing allotments. While the federal agencies manage the grazing lands by allotments, the state's biologists monitor water quality by watersheds, or hydrologic basins (as the hydrologists refer to them). If testing shows that a basin has water quality issues the biologists want to be able to identify all the grazing allotments that are in that basin. They can then work with the federal agencies to ensure the permit holders are conforming to best practices.
The biologists plan to use GIS to find out which grazing allotments are in a basin, and have obtained a layer of the allotments. As it turns out, the layer lists the management district for each allotment, along with other information, but not the hydrologic basin it falls within. Further, it seems that grazing allotments were not created with basin boundaries in mind, so an allotment can fall completely within a hydrologic basin, or can cross basin boundaries, falling in two or more basins. To be able to identify the allotments in a particular basin, the biologists need to assign each allotment the name and number of the hydrologic basin it falls in.

Assigning basin information to allotments
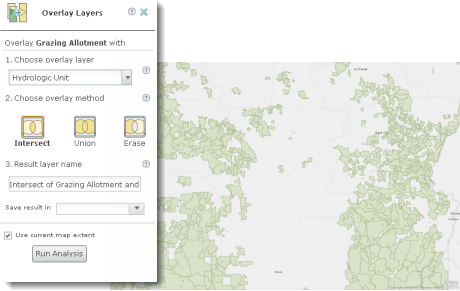
The biologists use ArcGIS to intersect the grazing allotments with a layer containing the hydrologic basins. The Intersect tool combines two layers to create a layer containing new features where input features overlap. The new features have all the attributes of the features in the input layers. In this case, the new allotment features are assigned the attributes-including the name and ID-of the hydrologic basin they fall within. Allotments that fall in two or more basins are split at the basin boundaries and the corresponding attributes assigned to each portion of the allotment.
Mapping and searching the overlay results
Having combined the two layers, the biologists can now map the grazing allotments by hydrologic basin.
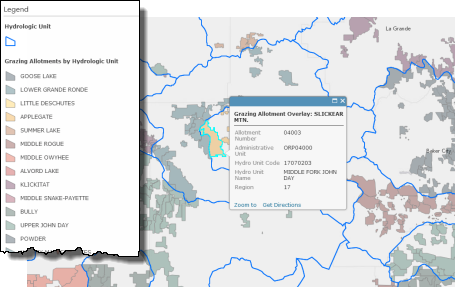
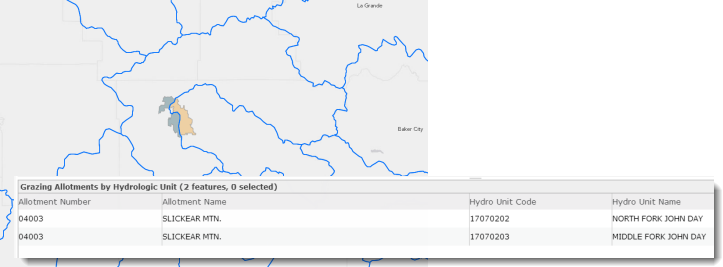
They can also quickly search the layer’s table to get a list of all the allotments in a particular basin.

Conversely, if they're researching a particular allotment, they can find out which basin, or basins, it falls in.
Assigning allotment information to streams
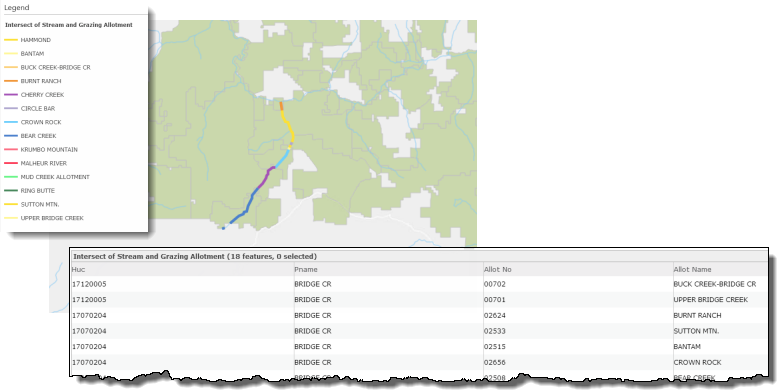
After several months, the biologists are finding the results of the analysis very useful. They have identified several hydrologic basins that seem to have chronic water quality issues and are working with local officials and the Bureau of Land Management, which administers the grazing allotments, to find solutions. To help identify the source of the pollution in each basin the biologists decide to assign the grazing allotment name and number to individual streams so they know which allotment each segment of each stream passes through. They again use intersect, this time overlaying grazing allotments with streams (area features can be overlaid with line or point features as well as other area features).
If field tests find a water quality issue with a particular stream, the biologists can filter the streams layer and find out which allotments the stream passes through. They can then link back to the federal database and get a report on each allotment (the type and number of livestock, the owner information, the administrating office, and so on). The information will help them determine the source of the pollution.
Workflow using ArcGIS Online
Find out which hydrologic basins each grazing allotment is in
-
Overlay grazing allotments with hydrologic basins using the Intersect option.
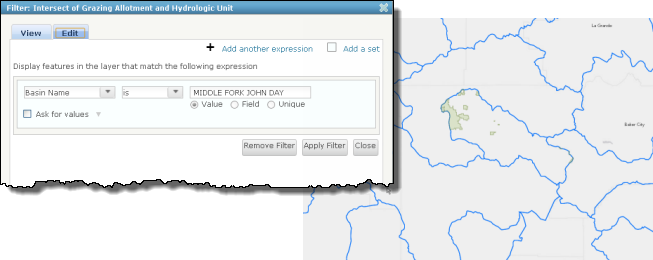
Display grazing allotments within a particular basin
-
Filter the grazing allotment and hydrologic basin intersect layer by basin name.
Display a particular grazing allotment to see which basins it is in
-
Filter the intersect layer by allotment number.

Find out which grazing allotments each stream passes through, if any
- Overlay streams with grazing allotments using the Intersect option. The output layer contains only those stream segments that cross a grazing allotment.
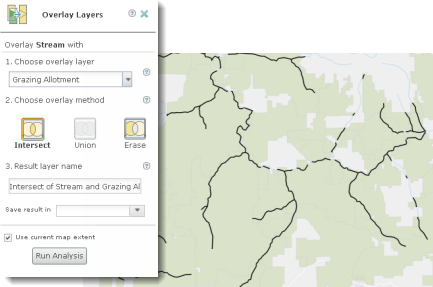
- Filter the stream and grazing allotment intersect layer by stream name.

Workflow using ArcGIS Desktop
Find out in which hydrologic basins each grazing allotment is
- Overlay grazing allotments with hydrologic basins using the Intersect tool.

Display grazing allotments within a particular basin
- Use Select By Attributes to select the basin for which you want to display the allotments. The selected features are highlighted on the map—the allotments (or portions of allotments) that fall in a particular basin.

- To display the features by themselves, use Create Layer From Selected Features. Then clear the selected features.
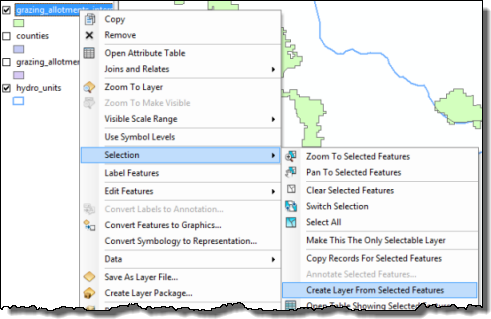
Display a particular grazing allotment to see which basins it is in
- Use Select By Attributes to select the allotment you want to display. The selected features are highlighted on the map. Again, use Create Layer From Selected Features to display the features by themselves.

Find out which grazing allotments each stream passes through, if any
- Overlay streams with grazing allotments using the Intersect tool. The output layer contains only those stream segments that cross a grazing allotment.
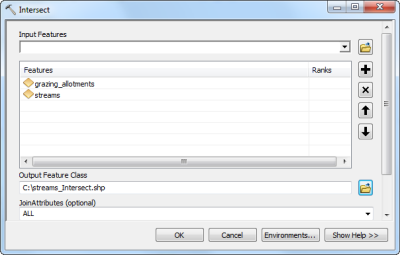
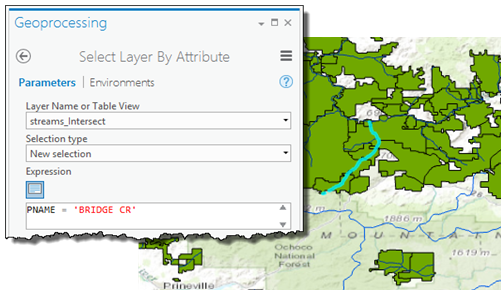
- Use Select By Attributes to select the stream you want to display. The selected features are highlighted on the map. Use Create Layer From Selected Features to create a layer containing the stream segments. You can then display the segments color coded by the allotment they cross.

Workflow using ArcGIS Pro
Find out in which hydrologic basins each grazing allotment is
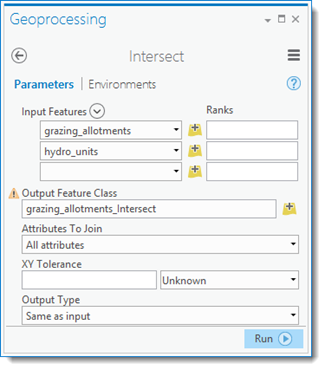
- Overlay grazing allotments with hydrologic basins using the Intersect tool.
Display grazing allotments within a particular basin
- Use Select Layer By Attribute to select the basin for which you want to display the allotments. The selected features are highlighted on the map—the allotments (or portions of allotments) that fall in a particular basin.

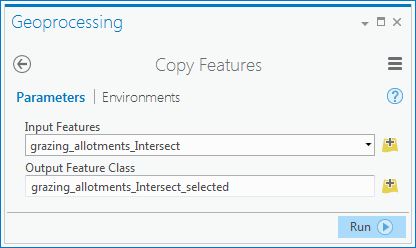
- To display the features by themselves, use Copy Features. Then clear the selected features.
Display a particular grazing allotment to see which basins it is in
- Use Select Layer By Attribute to select the allotment you want to display. The selected features are highlighted on the map. Again, use Copy Features to display the features by themselves.

Find out which grazing allotments each stream passes through, if any
- Overlay streams with grazing allotments using the Intersect tool. The output layer contains only those stream segments that cross a grazing allotment.
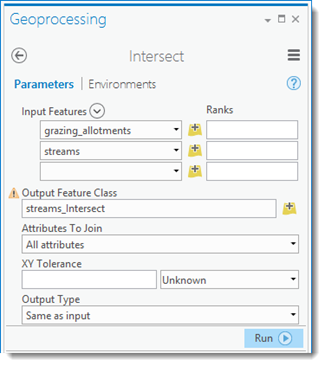
- Use Select Layer By Attribute to select the stream you want to display. The selected features are highlighted on the map. Use Copy Features to create a layer containing the stream segments. You can then display the segments color coded by the allotment they cross.
